Architect surveys report decline in billings

Image © BigStockPhoto
The results of two surveys—the American Society of Landscape Architects (ASLA) Business Quarterly survey and the American Institute of Architects (AIA) Architecture Billings Index (ABI)—suggest the building industry could be facing a decline.
The ASLA results are based on the responses of 188 primary firm contacts, received between October 3 and October 17. This survey compiles information on statistics such as billable hours, inquiries, and hiring plans to provide an industry overview.
The following results were obtained for the third quarter of 2016:
- billable hours were described as ‘significantly higher’ or ‘stable’ by 78.38 percent of firms—an increase from the 70.9 percent using this description in 2012, but a decrease from the 82.67 percent reported in the second quarter of this year and the 83.4 percent reported in 2015;
- year to year, compared to the third quarter of 2016, billable hours were described as significantly higher or stable by 80.44 percent of firms—a slight drop from 2015’s 81.3 percent and a significant increase from 2012’s 73.4 percent;
- inquiries for new work were described as significantly higher or stable by 80.33 percent of firms—this number is much higher than in 2012 (70.7 percent), but a slight decrease from the second quarter (81.03 percent) and from 2015 (81.56 percent);
- year to year, compared to the third quarter of 2016, inquiries for new work were described as significantly higher or stable by 81.97 percent of firms, decreasing from the 84.52 percent reported in 2015 but significantly increasing from the 77.5 percent reported in 2012; and
- plans to hire an experienced or entry-level landscape architect in the fourth quarter of 2016 were stated by 47.95 percent of firms with more than two employees, and 83.33 percent of those with 50 to 99.
Although many of these results report significant increases since 2012, it is important to note results have only declined in more recent years.
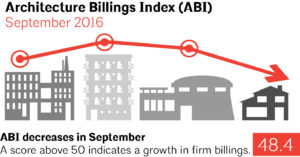
Image courtesy AIA
AIA’s billings, on the other hand, are measured in diffusion indexes, and determined from the results of a monthly survey sent to specific firms owned by association members. This survey inquires as to whether firms’ billings increased, decreased, or remained stable between the month just ending and the month prior to that. Resulting scores indicate an overall increase or decrease in billings, depending on whether the number is higher or lower than 50.
Regional averages and sector index breakdowns are calculated using data from across three months, while all other data is calculated on a monthly basis. The overall ABI provides indications regarding the nine- to 12-month lead time between architecture billings and construction spending.
ABI results for September are as stagnant as those obtained by ASLA. Demand for design services has declined over consecutive months for the first time in four years, as follows:
- an ABI score of 48.4 was calculated for September—a decrease from August’s 49.7;
- the new projects inquiries index, reported at 61.8 in August, has decreased to 59.4;
- regional averages of 53.4 for the South, 50.1 for the Midwest, 49.5 for the West, and 44 for the Northeast have been calculated;
- the sector index breakdown reports indexes of 50.4 for commercial and industrial, 49.8 for mixed practice, 49 for institutional, and 48.8 for multi-family residential; and
- the September design contracts index is 51.4—down from last month’s 52.7.
Both surveys report a decline in industry spending, however slight, across multiple sectors. AIA chief economist Kermit Baker offers a potential explanation for the decline.
“This recent backslide should act as a warning signal,” he says. “But this drop-off in demand could be continued hesitancy in the marketplace to move forward on projects until the presidential election is decided. The fact that new work coming into architecture continues to slowly increase suggests that billings will resume their growth in the coming months.”
Sign up for our weekly newsletter
Architectural materials and methods delivered right to your inbox
- CSI News and Notes: CSI Foundation’s construction camp; CSI spring exam; and more
- CSI News and Notes: CSI’s credentials; CSI conference theme; and more
- To be specific – CSI supports young AECO professionals
- CSI News and Notes: CSI’s foundation scholarships, national conference, and Crosswalk
- CSI News and Notes: AI’s impact; CSI 2024 conference, and more
Popular Articles
-
1
-
2
-
3
-
4
-
5
Read the Latest Issue