

As with mechanical stress, there are two types of thermal stress breaks: low- and high-stress.
Low-stress thermal breaks are often indicated by a single break line starting at the break origin point at or near the glass edge and propagating 50 mm or more before branching into more break lines (Figure 5). Damaged glass edges are the most frequent cause of low-stress thermal breakage.
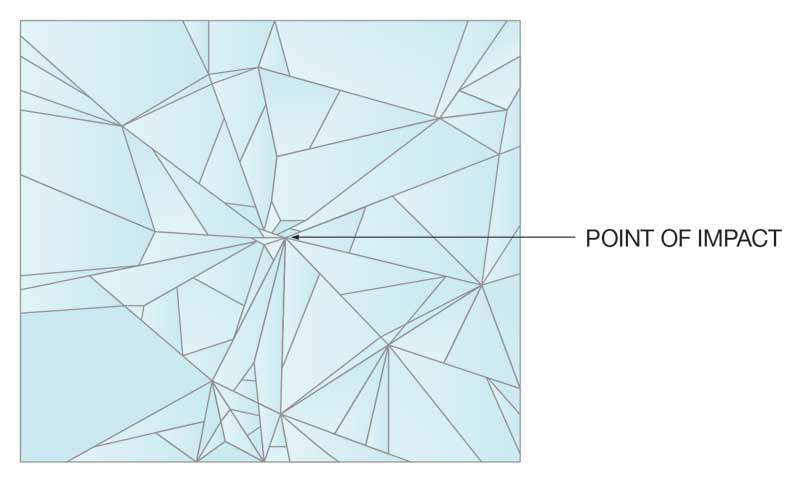
High-stress thermal breaks appear as a single break line starting at the break origin point at or near the glass edge and generally branch into additional breaks within 50 mm of the origin (Figure 6). This indicates a breakage brought on by conditions causing high thermal stress such as:
- severe outdoor shading on parts of the glazing;
- heating registers located between the glass and indoor shading devices;
- closed, light-colored drapes located close to the glass; or
- glazing in massive concrete, stone, or similar framing.
It is important to note most thermally induced stress breaks in architectural glazing applications occur in the winter, when it is colder overnight, and the low-angle morning sun heats the center of the glass more quickly than the edges.
Analyzing the break origin
A reliable method for estimating the stress level of a break at failure is a mirror radius (defined in ensuing paragraphs) measurement. Radius dimensions are determined by crack propagation velocity characteristics.
A crack propagates itself through glass with increasing velocity as it moves further from the point of origin. If an object has sufficient energy to propagate a crack through the thickness of the glass, then a spider web pattern will form. The lack of crystallographic planes in glass causes this type of crack to proceed perpendicular to the applied tension stress.
Near the point of origin, a smooth, mirror-like appearance on the fracture face indicates a low crack velocity. However, as velocity increases (due to higher tension stress), the fracture face takes on a frosted look. Then, at the highest velocity, it assumes a ragged or hackled appearance.
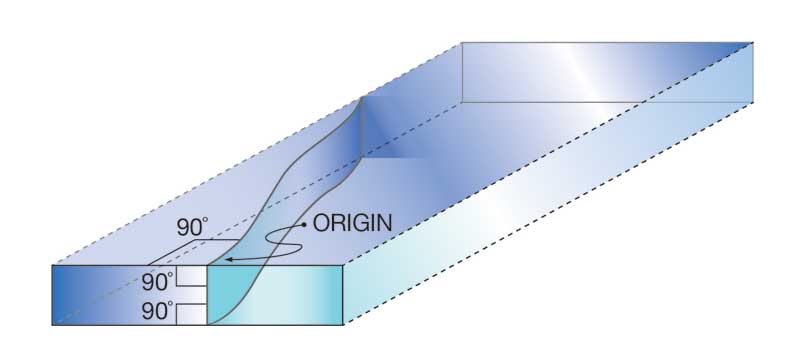
Mirror radii appear in various forms, depending on the stress level of the fracture. Figure 7 shows break origins resulting from high tensile stresses, such as bending or thermal stress breaks.
Figure 8 represents the break origins of glass fracturing at low bending stresses. In this example, a smooth fracture face forms across the thickness of the substrate. When the breaking stress is low, the mirror radius is often radial and may extend deeply into the substrate.
The relationship of the radius of the mirror surface of the break origin to the stress that caused the breakage is expressed by the following:![]() A deeper dive
A deeper dive
The graph in Figure 9 also shows the radius-to-stress relationship at various levels of breaking stress.

