

Code requirements for Larsen Health Center’s occupancy type and site location required a design of Risk Category III/Exposure C to resist three-second gusts (ultimate) wind speeds of 290 km/h (180 mph) which equate to approximately 253 km/h (157 mph) sustained winds.
A wall pressure chart and roof design zone map were developed based upon ASCE 7 guidelines, and in conjunction with specific requirements of the FBC Structural Design Chapter (16), used to specify roofing, exterior wall cladding, and exterior window and door design wind pressure requirements.
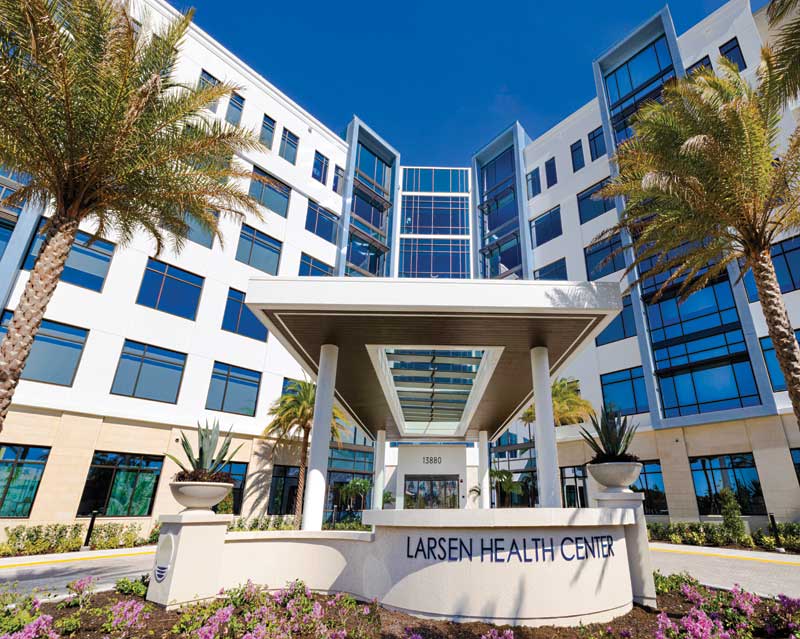
The use of a reinforced concrete structure and exterior concrete masonry unit (CMU) walls, aluminum storefront windows with impact glazing, and Florida/NOA (Miami-Dade Notice of Acceptance) approved products and installations for exterior openings (more on this below) provide this building the strength, security, and integrity needed to withstand wind forces through Category 4 Hurricanes.
Challenge of storm surge design
Coastal areas are also associated with flooding caused by storms, torrential rains, hurricanes, and even natural drainage issues. Flooding causes as much, if not more, damage than high winds, as well as increased safety concerns and reconstruction issues. Access by first responders may be delayed due to inundated access roads, debris, and dangerous power outages, all which affect re-supply of essential vendors and establishments.
What happens with this water?
A NASA-led study of 2017’s Hurricane Harvey’s flooding of Southeast Texas with more than 1.5 m (5 ft) of rainwater, the wettest recorded hurricane in U.S. history, “…determined in the first eight days post-landfall, 30 percent of Harvey’s stormwater was captured or stored on land—most as standing water that sits on the surface. Around 60 percent was lost or drained into the ocean and Galveston Bay over the first few days after the storm, and the remaining 10 percent was lost via evapotranspiration (ET), or a combination of evaporation and plant transpiration,” said first author Chris Milliner of NASA’s Jet Propulsion Laboratory in Pasadena, California.
In arguably the most famous flood in history, Noah waited more than 150 days for floodwater to recede, 47 days to find dry land, and 57 days to disembark from the Ark.
Survey and Sea, Lake, and Overland Surges from Hurricanes (SLOSH) information
Most site elevations are referenced to North American Vertical Datum 1988 (NAVD 1988) or to National Geodetic Vertical Datum of 1929 (NGVD 29). The difference between the two, from a conversion standpoint, varies depending on the site. Most codes will require building floors to be at a certain base flood elevation (BFE) and, may in fact, require them to be 0.3 to 0.6 m (1 to 2 ft) higher, depending on use and occupancy. The Sea, Lake, and Overland Surges from Hurricanes (SLOSH) is a numeric computer model, developed by the Federal Emergency Management Agency (FEMA), United States Army Corps of Engineers (USACE), and the National Weather Service (NWS) to predict storm surge driven heights using various historical, atmospheric, topographic, and wind field data. The elevations are given in NAVD 1988 and reference the elevation above ground (sea) level. The map below indicates storm surge basins—the reasonable upper bound of potential flooding of normally dry land—unsurprisingly affecting coastal areas.

