Condensation: Why fenestration component selection matters
The study
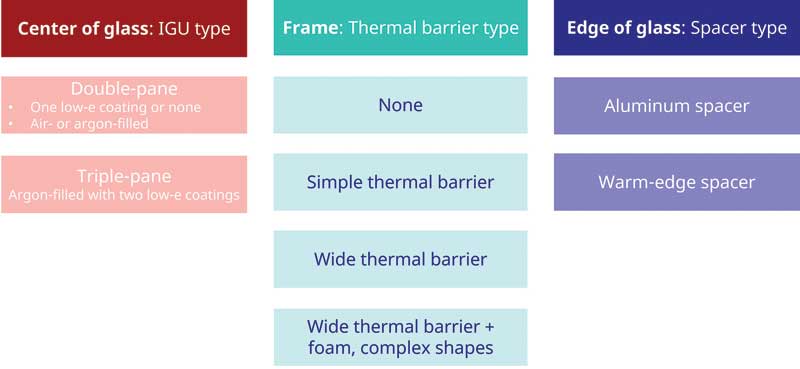
Using Lawrence Berkeley National Laboratory’s (LBNL) THERM software, simulations were conducted to calculate the temperature distribution within the window details and determine the temperatures along the room-side surfaces of the glass, gaskets, and frame. Simulations evaluated 11 different window types with a wide range of performance, ranked by CR values from 16 to 72 and U-factors from 3.1 to 1.0 W/m2K (0.54 to 0.18 Btu/F.hr.sf). Figure 3 provides an overview of the combinations of IGU, thermal barrier, and spacer types used in the 11 windows under evaluation.
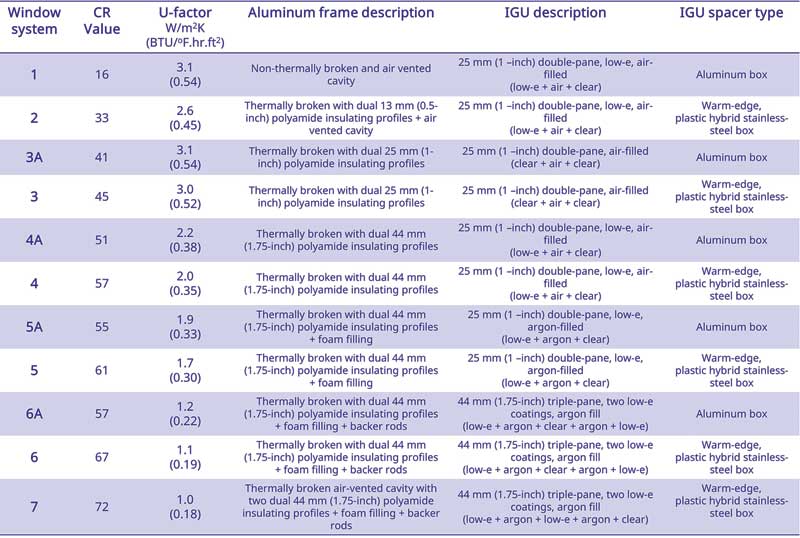
Selected window systems are summarized in Figure 4 and details are shown within. Systems with the letter “A” denote that an aluminum spacer was used in lieu of a warm-edge spacer (except for System 1—the lowest performance base system—which also used an aluminum spacer).
The NFRC fixed window model was used with a standard size of 1,200-mm (47.2-in.) width by 1,500-mm (59.1-in.) height for all analyzed window systems. Head, jamb, and sill details were simulated at three interior relative humidity (RH) conditions: 30 percent RH, 50 percent RH, 60 percent RH at 21 C (70 F), and six exterior temperatures: -1 C (30 F), -7 C (20 F), -12 C (10 F), -18 C (0 F), -23 C (-10 F), and -29 C (-20 F). Exterior RH was maintained at 50 percent RH. Since the head exhibited condensation first, and to greater extents than the jamb and sill, the study focused on the head detail. The total data set included almost 600 simulations.
It should be noted that this 2D simulation study could make condensation look worse than reality. However, it is expected that the relative trends between window systems are similar. Also, the impacts of window treatments are ignored, which often increase condensation risk.
Assessing condensation
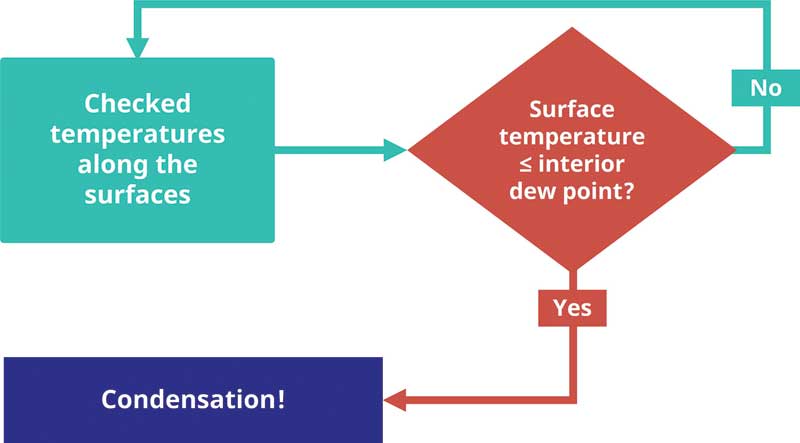
First, for each interior condition, the dew point was calculated using NFRC recommended dew point calculator.2 Next, the surface temperatures along the frame and EOG surfaces were compared to the dew point to determine if condensation would occur (Figure 5). This process was repeated along the entire frame and EOG surfaces to determine the extent of condensation on the fenestration surfaces.
To illustrate the takeaways, the coverage of condensation over the perimeter of each fenestration system evaluated is illustrated and described below for the worst-case environmental condition of -29 C (-20 F) outside temperature and 60 percent interior RH (Figures 6 through 12). For systems 6 and 7, that did not have condensation at this worst case, more severe conditions were assessed.
When and where condensation occurs
System 1 (CR=16) understandably performed the worst because it had a non-thermally broken aluminum frame with an air-vented cavity. When condensation occurred, it covered the entirety of the frame surface—its surface temperature was low and uniform due to high aluminum conductance. Condensation occurred on the frame at higher outside temperatures than the glass (e.g. -7 C [20 F] compared to -23 C [10 F] at 50 percent RH), demonstrating the EOG was of higher thermal performance than the frame, even with an aluminum box spacer.
Sign up for our weekly newsletter
Architectural materials and methods delivered right to your inbox
- CSI News & Notes: CSI’s impact earns official recognition; celebrate leaders, mentors, and innovators; and more
- CSI News and Notes: CSI spring certification exams open; scholarships available; and more
- CSI News & Notes: CSI MSR heading to San Diego; spring certification exams open; and more
- To Be Specific: Why CDT Should Be Your First Move
- CSI News & Notes: CSI Fellows share member benefits; and a New Year’s Resolution to keep
Products

Read the Latest Issue