Condensation: Why fenestration component selection matters
by arslan_ahmed | June 8, 2023 6:00 pm
 [1]
[1]By Alexandra Blakeslee and Helen Sanders, PhD
Condensation is an important, but sometimes an overlooked failure mode when specifying glazing. Condensation can be an issue in any climate or building where the interior surface falls below the dew point. This is especially important in areas where outdoor temperatures are low, such as in Northern climates in winter months, and where there are high levels of humidity, such as hospitals, laboratories, museums, and multifamily housing.
The condensation resistance (CR) rating, developed by the National Fenestration Rating Council (NFRC) has long been used as a metric to assess condensation risk for fenestration. Theoretically, as fenestration thermal transmittance (U-factor) reduces, the improved thermal performance should help maintain higher interior surface temperatures above the dew point, preventing condensation.
However, it is well established that U-factor and CR do not perfectly correlate. This is because condensation is typically driven by thermal bridging at the fenestration perimeter—the frame and edge of glass (EOG). The fenestration U-factor, being the area-weighted average of frame, EOG, and center of glass (COG) U-factors, can mask perimeter thermal bridging using high thermal performance in the COG.
In addition, CR values do not predict how much or where condensation could potentially occur for a window assembly under specific environmental conditions. The CR value, which is a number from one to 100, provides only a qualitative way of comparing different fenestration systems and their relative risk of condensation. This can be a challenge for the specifier who needs to better quantify condensation performance.
In 2022, the authors collaborated with researchers at the University of Massachusetts, Ajla Aksamija, PhD, and Suncica Milosevic, to quantify the potential for condensation on a variety of window systems.1 Eleven different aluminum architectural window systems spanning a wide range of heat transfer coefficients (U-factors) and CR ratings were investigated. The research results and implications for fenestration specification are summarized herein.
Strategies for improving fenestration thermal performance
Before diving into the drivers of condensation, it is important to understand the ways in which fenestration thermal performance can be improved. Many of these strategies are used to create the range of window systems used in the condensation evaluation.
Improving the frame
Eighty-five percent of the thermal bridging of windows occurs at the perimeter. Conduction through the frame and edge of glass is responsible for 50 percent of the energy flow, convection accounts for 35 percent, and radiation accounts for the remainder (Figure 1).
Improving the performance of aluminum frames typically starts with reducing the conductive heat flow by making a break in the continuous metal using a non-metal material. These are called thermal barriers and the wider the thermal barrier, the lower the thermal conduction. For polyamide (PA) thermal barriers, widths from 10-mm (0.4-in.) up to 100-mm (4-in.) are possible.
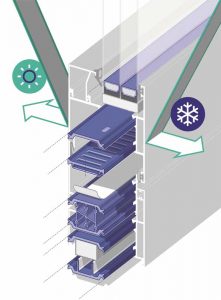
Once conduction is addressed, strategies to reduce convective heat transfer, such as adding legs or foam to the thermal barriers, can be introduced (Figure 2). These strategies stop convection currents by breaking up or filling large cavities formed in the extrusions. Additional performance can be gained by reducing the thermal conductivity of the polyamide (low lambda) or adding reflective surfaces to reduce radiative heat flow.
Used in this simulation study were (i) simple 13-mm (0.5-in.) wide PA thermal barriers, (ii) wider 25-mm (1-in.) PA thermal barriers, and (iii) 44-mm (1.75-in.) wide high-performance PA systems using various foam filling and complex geometries for convection mitigation.
Improving the edge of glass (EOG)
Historically, highly conductive aluminum box spacer has been used in insulating glass units (IGUs). If a spacer is not specified in project documents, aluminum box spacer is likely what will be delivered, since it is typically the least expensive option.
To reduce thermal conduction across the EOG, aluminum box spacer can be replaced with lower conductivity options generically called “warm-edge” spacer. While stainless-steel versions of the standard box spacer are considered warm-edge, those used in commercial applications tend to only deliver a 0.06 W/m2K (0.01 BTU/F.hr.sf) improvement in window assembly U-factor, whereas using lower conductivity warm-edge spacer delivers a 0.11 to 0.17 W/m2K (0.02 to 0.03 BTU/F.hr.sf) improvement.
 [3]
[3]Several lower conductivity warm-edge options are available, including the industry standard plastic hybrid stainless steel (PHSS) box spacer (Figure 2), which delivers the same thermal performance as non-metal spacer, with the benchmark durability of a metal box spacer. The engineered plastic bridging the top reduces heat flow across the cavity, while the low conductivity thin stainless steel wrapping the back and sides provides an excellent vapor and gas barrier, as well as an effective sealing surface. As an example of warm-edge performance, the PHSS spacer was used in the simulation study in comparison to a high-conductivity aluminum box spacer.
Improving the center of glass (COG)
The COG performance is driven by the number, position, and type of low-emissivity (low-e) coatings, the size and number of cavities (double-pane versus triple-pane), and if inert gas filling is used.
A typical 25-mm (1-in.) dual-pane IGU with a double silver low-e coating on the inside of the exterior pane (surface #2) and an air-filled 13-mm (0.5-in.) cavity, has a COG U-factor of 1.65 W/m2K (0.29 BTU/F.hr.sf.) Adding argon typically reduces the COG U-factor to 1.42 W/m2K (0.25 BTU/F.hr.sf.) Changing the double-silver to a triple-silver low-e reduces the COG U-factor further to 1.36 W/m2K (0.24 BTU/F.hr.sf.)
Further reductions to 1.0 W/m2K (0.18 BTU/F.hr.sf) can be made by adding a second cavity to create a triple-pane IGU. Triple-pane performance can be enhanced yet further, achieving U-factors as low as 0.74 W/m2K (0.13 BTU/F.hr.sf) by adding a second low-e coating.
Adding a second low-e coating on the room-side surface of a dual-pane IGU—called a fourth surface low-e—provides an intermediate step in performance before moving to a triple-pane, achieving COG U-factors of 1.14 W/m2K (0.20 BTU/F.hr.sf). It does, however, lower the temperature of the room-side glass surface, increasing condensation risk. In this study, fourth surface low-e coatings were not evaluated. Condensation risk should be evaluated carefully, especially for high-humidity applications, when considering these coatings.
Key condensation questions
For the window systems chosen for the condensation analysis (each with different U-factors and CR ratings) the following questions were addressed:
- Under which exterior and interior environmental conditions does condensation occur? And to what extent? How much of the fenestration’s outer perimeter, extending from the outer edge of the frame to the gaskets to the glass surface, is predicted to be covered by moisture?
- On what part of the window does condensation develop first?
- Is there a correlation between the occurrence and extent of condensation, and the CR value?
- Is there a correlation between the occurrence and extent of condensation and the U-factor value?
- How do higher-performing components (warm-edge spacers, frames that integrate wide thermal barriers, improved COG thermal performance) impact the CR value, as well as improve resistance to condensation?
 [4]
[4]The study
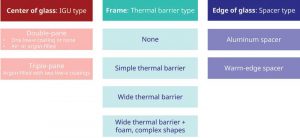
Using Lawrence Berkeley National Laboratory’s (LBNL) THERM software, simulations were conducted to calculate the temperature distribution within the window details and determine the temperatures along the room-side surfaces of the glass, gaskets, and frame. Simulations evaluated 11 different window types with a wide range of performance, ranked by CR values from 16 to 72 and U-factors from 3.1 to 1.0 W/m2K (0.54 to 0.18 Btu/F.hr.sf). Figure 3 provides an overview of the combinations of IGU, thermal barrier, and spacer types used in the 11 windows under evaluation.
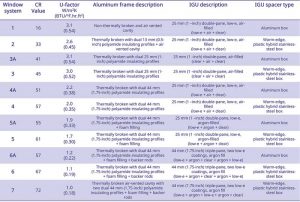
Selected window systems are summarized in Figure 4 and details are shown within. Systems with the letter “A” denote that an aluminum spacer was used in lieu of a warm-edge spacer (except for System 1—the lowest performance base system—which also used an aluminum spacer).
The NFRC fixed window model was used with a standard size of 1,200-mm (47.2-in.) width by 1,500-mm (59.1-in.) height for all analyzed window systems. Head, jamb, and sill details were simulated at three interior relative humidity (RH) conditions: 30 percent RH, 50 percent RH, 60 percent RH at 21 C (70 F), and six exterior temperatures: -1 C (30 F), -7 C (20 F), -12 C (10 F), -18 C (0 F), -23 C (-10 F), and -29 C (-20 F). Exterior RH was maintained at 50 percent RH. Since the head exhibited condensation first, and to greater extents than the jamb and sill, the study focused on the head detail. The total data set included almost 600 simulations.
It should be noted that this 2D simulation study could make condensation look worse than reality. However, it is expected that the relative trends between window systems are similar. Also, the impacts of window treatments are ignored, which often increase condensation risk.
 [5]
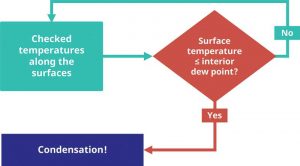
[5]Assessing condensation
First, for each interior condition, the dew point was calculated using NFRC recommended dew point calculator.2 Next, the surface temperatures along the frame and EOG surfaces were compared to the dew point to determine if condensation would occur (Figure 5). This process was repeated along the entire frame and EOG surfaces to determine the extent of condensation on the fenestration surfaces.
To illustrate the takeaways, the coverage of condensation over the perimeter of each fenestration system evaluated is illustrated and described below for the worst-case environmental condition of -29 C (-20 F) outside temperature and 60 percent interior RH (Figures 6 through 12). For systems 6 and 7, that did not have condensation at this worst case, more severe conditions were assessed.
 [6]
[6]When and where condensation occurs
System 1 (CR=16) understandably performed the worst because it had a non-thermally broken aluminum frame with an air-vented cavity. When condensation occurred, it covered the entirety of the frame surface—its surface temperature was low and uniform due to high aluminum conductance. Condensation occurred on the frame at higher outside temperatures than the glass (e.g. -7 C [20 F] compared to -23 C [10 F] at 50 percent RH), demonstrating the EOG was of higher thermal performance than the frame, even with an aluminum box spacer.
 [7]
[7]Condensation first occurring on the frame rather than the EOG indicates the CR rating cannot differentiate between the individualized performance of the glazing compared to the frame. In addition, the CR rating is not indicative of the threshold for which condensation begins, considering it was sudden and covered the whole frame even at a typical environmental condition of -7 C (20 F) exterior temperature and 50 percent interior RH, in comparison, the other system’s condensation gradually increased with each harsher environmental condition.
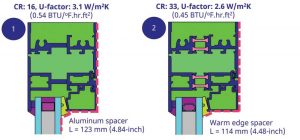
System 2 incorporated a small 13-mm (0.5-in.) thermal barrier and warm-edge spacer into the same frame as in system 1. These changes doubled the CR rating and improved the U-factor by 17 percent. Even though this system was improved and first experienced condensation at a higher humidity (50 percent RH), when condensation did occur, it still covered the full width of the frame (Figure 6). While condensation was reduced at the EOG because of the lower conductivity warm-edge spacer, condensation was dominated by the poorer thermal performance of the air-vented frame.
This also indicates that improved U-factor and CR do not directly indicate a relatively higher resistance to or lower amounts of condensation and that the performance of the individual components matters. A much higher condensation resistance would perhaps have been expected with a doubling of the CR value.
Systems 3A (aluminum spacer) and 3 (warm-edge spacer) had a higher performance frame; a larger thermal barrier at 25-mm (1-in.) and no
air-vent. The COG U-factor in these systems was downgraded by removing the low-e coating, compared to system 2. Note the U-factor for systems 3A and 1 are similar, yet their CR values are markedly different.
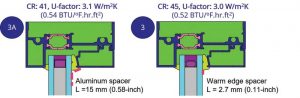 [8]
[8]In systems 3A and 3, the spacer starts to become more influential in condensation performance, since the frame has a wider thermal barrier than system 2. For every environmental condition and fenestration system studied, replacing the aluminum spacer with a warm-edge spacer (system 3A versus 3), reduces the condensation extent (Figure 7). Condensation first occurred for system 3A at similar environmental conditions as system 2, but the extent doubled. This can be attributed to the improved frame, which was not affected by surface condensation.
In addition, system 3 has significantly improved condensation performance compared to system 3A. It only experienced condensation at the worst case of -29 C (-20 F) exterior temperature, 60 percent interior RH, and at lower temperatures in the other scenarios which could only be attributed to the introduction of a warm-edge spacer, all other things equal.
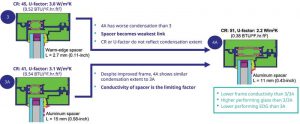 [9]
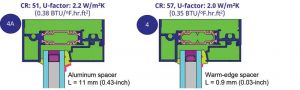
[9]System 4A used a very wide thermal barrier and an aluminum spacer. This system had a higher CR rating (51) and lower U-factor (2.2 W/m2K, 0.38 BTU/F.hr.ft2) than system 3 (CR 45, U-factor = 3.0 W/m2K, 0.52 BTU/F.hr.sf) with the smaller thermal barrier and warm-edge spacer. Yet, there was a larger extent of condensation in the higher-rated 4A system under similar conditions compared to the system 3 (Figure 8). This reinforces the strong influence of the spacer conductivity on condensation. It also identifies a weakness in the rating systems which does not account for this influence in CR nor U-factor.


Compared with system 3A, which also used an aluminum spacer, but a smaller thermal barrier, 4A showed no major difference in extent of condensation, despite the higher thermal performance frame. This further indicates that spacer conductivity drives the extent of condensation once the frame conductivity is sufficiently reduced.
When comparing system 4A with 4 (Figure 9), where the only difference is spacer conductivity, the warm-edge spacer significantly reduced the extent of condensation.
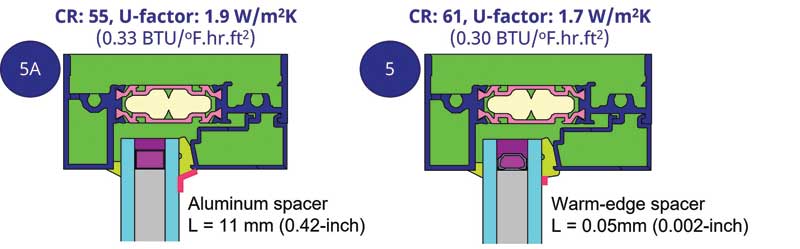
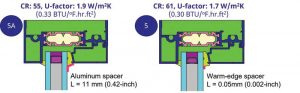
Systems 5A and 5 showed similar results as 4A and 4: (i) CR and U-factor improvements did not translate to less condensation at the given environmental conditions and (ii) incorporating a warm-edge spacer in system 5 made a significant improvement compared to 5A (Figure 10).
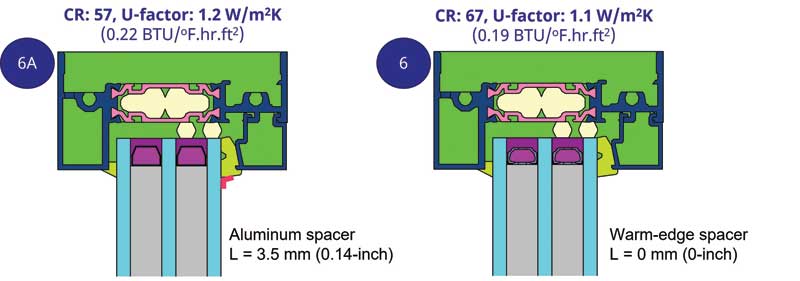
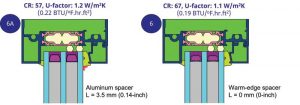
Systems 6A and 6 incorporate triple glazing, which reduces the condensation extent further (Figure 11). System 6, with the warm-edge spacer, had no condensation under any of the environmental conditions, yet system 6A with aluminum spacer still exhibits some condensation—because of the conductive spacer. To attempt to bring system 6 to a point of condensation, it was simulated at outside temperatures down to -62 C (-80 F). Even at this extreme condition, it did not experience condensation at 60 percent RH.
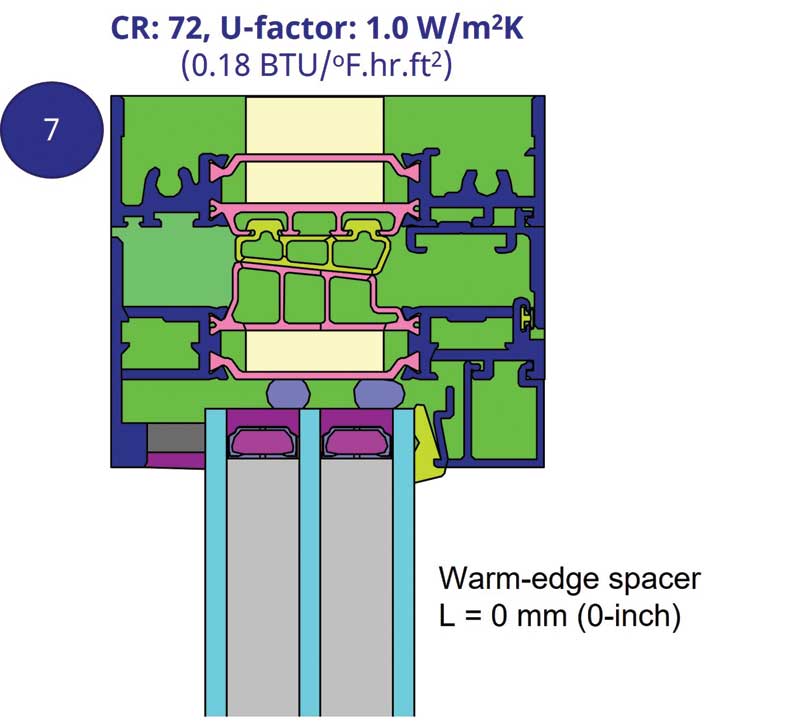
System 7 (Figure 12) with an even lower conductance frame, behaved like system 6. It was evaluated at further environmental extremes and did not experience condensation until an exterior temperature of -68 C (-90 F), a very unlikely condition.
Takeaways for fenestration specification
Based on this study, below are some key takeaways and recommendations for fenestration specification to manage condensation risk:
- In addition to reinforcing the lack of correlation between U-factor and CR value, the results identify a lack of correlation between CR value and the extent of condensation. Condensation is driven by the combination of all window assembly components (the frame, the EOG, and the COG) and their material properties, rather than assembly U-factor or CR value.
- The window system’s individual components matter for condensation performance: CR value is not a predictor of the extent to which condensation covers fenestration surfaces, but rather this is determined by the thermal performance of the window system components: Frame, spacer, IGU configuration. Moreover, some windows with similar U-factors and CR values performed drastically different relative to condensation, exhibiting an 80 percent difference in the extent of condensation under identical conditions. This is attributed to differences in the material properties of their individual components, specifically the spacer in the IGUs.
- The weakest thermal link in the fenestration assembly drives condensation performance: The weakest thermal link is determined by the path of least resistance to heat flow, and is typically the frame, followed by the EOG. Recall that for window types with lowest performing frames, condensation occurred first along the interior surface of the frame. When frame thermal performance was improved, condensation occurred first at the EOG.
- First, improve the thermal performance of the frame, by adding wide and complex thermal barriers; then, improve the EOG, by adding a warm-edge spacer. In this study, condensation occurred along the EOG for window types with wide thermal barriers. The presence of a warm-edge spacer in place of an aluminum spacer significantly reduced this condensation. Further, in these simulations, for windows with a high-performance frame, warm-edge spacer, and triple-pane COG (CR >/= 67), condensation occurred only under extreme and highly unlikely conditions, if at all.
- Specify the performance of the individual fenestration components (frame, EOG, COG), in addition to specifying the fenestration assembly U-factor and CR value. Frame performance can be specified by defining a thermal barrier type and width (e.g. at least 25-mm [1-in.]), or by specifying one or more manufacturers’ frames which have the desired performance. Ideally, warm-edge spacer should be specified by type (e.g. PHSS) or by EOG effective conductivity (Keff), rather than generically as “warm-edge.” Generic “warm-edge” includes relatively high-conductance stainless-steel spacer. Neglecting to specify an IGU spacer typically results in the delivery of an aluminum spacer, which is a risk for condensation.’
Notes
1 S. Milosevic, A. Aksamija, A. Blakeslee, H. Sanders; Condensation Study of Windows: Thermal Analysis of Various Window Systems under Different Exterior Environmental Conditions; Façade Tectonics World Congress, October 2022; www.facadetectonics.org/papers/condensation-study-of-windows[10].
2 Dew point calculator www.dpcalc.com/[11].
Author
 Part of Technoform’s team for nearly 10 years, Alexandra Blakeslee drives product innovation and technical collaborations with customers and industry and academic partners. She co-manages Technoform North America’s market team focused on edge bond solutions for insulating glass in windows, doors, and other fenestration systems. She earned a bachelor’s degree in mechanical engineering and music from the University of Akron and is pursuing a master’s in sustainable environmental systems from Pratt Institute. Blakeslee is an active member of the Facade Tectonics Institute (FTI), the Fenestration and Glazing Industry Alliance (FGIA), and other industry associations and events. She can be reached at alexandra.blakeslee@technoform.com.
 Helen Sanders, PhD, is a general manager at Technoform North America. She has more than 25 years of experience in glass technology, market development, and manufacturing, especially in functional coatings, insulating glass, and thermal zone technology for fenestration. Sanders has a doctorate in surface science from the University of Cambridge, England. She is an active member of many industry organizations and in codes and standards development. She is the founding president of the FTI and is currently the immediate past president. She is a board member of the National Fenestration Rating Council (NFRC) and of the FGIA, co-chair of its Glass Products Council, and of its Innovation and Sustainability Steering Committees; and a technical liaison on the National Glass Association’s (NGA’s) Fabricating Committee. Sanders can be reached at helen.sanders@technoform.com.
- [Image]: https://www.constructionspecifier.com/wp-content/uploads/2023/06/Technoform_AB-707Fifth_SteveLeBlanc1.jpg
- [Image]: https://www.constructionspecifier.com/wp-content/uploads/2023/06/Figure1_Thermal-transfer-in-a-window_Technoform.jpg
- [Image]: https://www.constructionspecifier.com/wp-content/uploads/2023/06/Figure2_Thermal-improvement-strategies_Technoform.jpg
- [Image]: https://www.constructionspecifier.com/wp-content/uploads/2023/06/Figure3_Study-Summary_Technoform.jpg
- [Image]: https://www.constructionspecifier.com/wp-content/uploads/2023/06/Figure4_Table-of-window-performance_Technoform_new.jpg
- [Image]: https://www.constructionspecifier.com/wp-content/uploads/2023/06/Figure5_Process-for-determining-condensation_Technoform.jpg
- [Image]: https://www.constructionspecifier.com/wp-content/uploads/2023/06/Figure6_System1and2_Technoform-SMilosevic-AAksamija.jpg
- [Image]: https://www.constructionspecifier.com/wp-content/uploads/2023/06/Figure7_System3and3A_Technoform-SMilosevic-AAksamija_new.jpg
- [Image]: https://www.constructionspecifier.com/wp-content/uploads/2023/06/Figure8_System3A-3-4Acomparison_Technoform-SMilosevic-AAksamija.jpg
- www.facadetectonics.org/papers/condensation-study-of-windows: https://www.facadetectonics.org/papers/condensation-study-of-windows
- www.dpcalc.com/: http://www.dpcalc.com/
Source URL: https://www.constructionspecifier.com/condensation-why-fenestration-component-selection-matters/