Dispatch from Alaska: Insights on moisture, soil, and material performance
by arslan_ahmed | December 16, 2022 9:00 am
 [1]
[1]By Tiffany Coppock
“As engineers, we always have options,” says Billy Connor, director of the Arctic Infrastructure Development Center at the University of Alaska. Connor explains the job of the engineer is to specify the best material option in terms of cost, durability, and performance, as well as the owner or client’s desire. His research demonstrates another aspect of the engineer’s work—patience.
Since the mid-1980s, Connor and his colleagues have studied the performance of foam insulations installed in Alaska’s harsh permafrost terrain.
As the research continues to yield insights on how extruded polystyrene insulation (XPS) and expanded polystyrene insulation (EPS) tolerate moisture and retain thermal performance, it also poses new questions about the behavior of liquid and vapor moisture in soil.
Research conducted by Connor and researcher colleagues at the University of Alaska sought to expand the understanding of how both rigid foam insulations (XPS and EPS) perform over time when confronted by harsh conditions in below-grade applications. The most recent study, conducted in 2019, built on previous findings from research done in Alaska and Canada, examines the use of insulation in roadway embankments and airport runways.
In the study, insulation samples recovered from below-ground locations were examined for water absorption, water retention, and R-value maintenance. Project focal points included collecting new samples to expand on relevant data and reexamining the current data in light of new information. An additional goal was to develop a strategy for planning how best to incorporate insulation into roadside and airport projects based on an understanding of material performance.
Data gathered suggested thicker layers of EPS were needed to match the performance of XPS insulation in these situations. Researchers proposed several calculation options to determine the necessary thicknesses.
Insulating roadbeds and runways
Permafrost is the sub-surface layer of soil and rock where the temperature remains continuously below 0 C (32 F) for a minimum of two years and as many as hundreds of thousands of years. In Alaska, permafrost is found below about 85 percent of the state, according to the National Resources Defense Council (NRDC). Permafrost also is widespread in Canada and throughout the Northern Hemisphere.1 However, rising global temperatures have been increasing permafrost thaw, heightening interest on how to protect permafrost regions most effectively. Reports estimate 6.4 million km2 (2.5 million mi2) of permafrost may thaw by the end of the century.2
One concern is, when permafrost soils thaw, additional levels of previously trapped greenhouse gases will be released, further increasing the rate of climate change. Damage to buildings, roads, and paved areas is another side effect of thawing permafrost layers.
As the ground warms, previously solid areas can shift, causing roads and structures to warp and crack. In Canada, for example, about 3000 to 4000 km (1800 to 2500 mi) of road run over permafrost and roughly half of the paved area is in danger of becoming unstable from thawing ground.3 Much of the worst damage has occurred on a type of permafrost already susceptible to thawing, as it has a high ice content mixed with silty soils. This type of thaw-unstable permafrost is most likely to see damage from infrastructure work, according to the Alaska Department of Transportation. This type of permafrost is also found under parts of main arterial highways and critical rural airports across Alaska.4
Thaw damage to roadbeds and runways should not be confused with damage caused by freezing or the frost heaves which occur when water gets under a paved surface and freezes. As the ice expands, it creates raised bumps in the roadbed, which become unsupported once the ice melts when temperatures warm. When the permafrost—the foundation upon which the roadway is placed—thaws, the roadway becomes unstable much further below the road surface. One way to help protect permafrost is to take steps to ensure the road stays as cold as possible. This includes insulating embankments and paved areas, along with selecting materials that encourage cold air to flow within the embankment. These measures help keep underlying layers cooler by preventing the transfer of heat further into the ground.4 Insulation also has been used to help prevent the development of frost heaves.
Project overview and material collection
Although there have been several studies examining the use of XPS and EPS insulation, they tend to focus on short spans of time rather than extended use and less harsh exposure, such as vertical applications in walls.
An initial study looking at this topic was done in 1986 by David Esch, with early work in Canada done by Pouliot and Savard in 2003. The findings from the most recent examination of projects in Alaska expand the data set established by these two projects and the analysis work of Cai, Zhang, and Cremaschi done in 2017.6,7,8
The Esch study examined 18 samples from eight sites in Alaska. The XPS insulation came from six locations, averaging nine years of service life, with the longest service life going up to 20 years. The EPS insulation had been in place from three to 15 years. Both insulations were checked for water content and long-range R-value. Samples of XPS insulation were found to have an average water content of 1.16 percent by volume, with individual samples ranging from 0.23 to 2.38 percent, while the average water content in the EPS insulation was 2.9 percent by volume, with individual results ranging from 1.18 to 5.88 percent. The average long-range R-value of XPS insulation was 3.9, while the average R-value for EPS insulation was 2.6.
Similarly, Pouliot, and Savard examined the performance of EPS and XPS at locations in Canada. They considered the insulations’ water uptake and thermal conductivity. Insulation samples had been in situ for one, three, five, and seven years, and the thermal conductivity of the material was checked against a sample taken at the time of construction. The evaluation found that average thermal conductivity for EPS was 0.036W/K*m (0.250 BTU in./hr sf F), while it was 0.030 W/K*m (0.208 BTU in./hr sf F) for XPS insulation. Stated another way, the R-value is 4.000 for EPS and 4.808 for XPS.
Current testing standards which limit predictive assessments
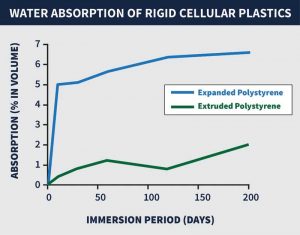
A Canada-based research team also conducted water absorption trials using ASTM D2842, Standard Test Method for Water Absorption of Rigid Cellular Plastics.9 The water immersion tests found EPS absorbed about five percent water by volume in 10 days, a pace which slowed to a total of 6.2 percent water by volume after 200 days. In contrast, following 200 days immersion time, the XPS insulation collected two percent moisture by volume (see Figure 1).
 [2]
[2]While such testing is the approved standard, Connor notes this testing does not serve as a good indicator of a material’s performance in situ. “Just submerging insulation is not a good indicator of its performance in locations, such as a building’s roof or in the ground,” he says. “What we really want to know is what a material’s R-value is likely to be in service. I do not care about performance in the factory; I care about how it’s going to perform in the soil over time.”
Thus far, no testing has measured vapor pressure in the ground; however, the area is inspiring additional research. Connor adds how, beyond tests designed to better reflect real-world conditions, the industry needs more predictive tools to evaluate the performance of insulation and other materials in various locations. Unlike situations when insulation is used in walls, when used in below-grade situations, insulation does not dry after it starts collecting moisture. This difference makes testing which involves drying samples less relevant than it would be in other situations. Once wet, insulation in the ground will stay moist and continue to see performance influence from water.
Understanding moisture’s migration into insulation
In 2017, Cai, Zhang, and Cremaschi examined how water absorption happens with rigid foam board insulation when it is used in buildings.8 In those situations, the properties of absorption, diffusion, and capillary action occur. When humidity is 30 percent or below, absorption has been the main method of water transfer, and when humidity is above 80 percent, capillary action becomes primary.
 [3]
[3]The research team also looked at the type of tests used with insulation, noting that while the four-day immersion test ASTM D2842 could indicate a water content for EPS close to what is found when the insulation is in place for less than six years, it tends to underpredict the moisture content for XPS. As Connor observed, they suggest immersion tests are not an accurate way to predict long-term performance for either type of insulation when used below-grade in roadway scenarios. However, their results did indicate how the four-day immersion test could be used to provide a quality control (QC) test.
Connor’s new research sought to add data to the previously established points by collecting and evaluating additional samples of insulation. Recent changes to the makeup of EPS insulation (a coating was added to the top and bottom of the material) also were examined. Insulation samples were gathered from three locations:
- Dalton Highway, originally placed in 2013 (EPS)
- Cripple Creek, originally placed in 1997 (EPS)
- Golovin Airport, originally placed in 1987 (XPS)
Insulation samples were excavated and sealed in polyethylene bags before being sent for third-party testing. All samples saw 6.4 mm (0.25 in.) of material trimmed from each side before testing to remove soil contamination and damage. Insulation was tested for thermal performance in accordance with ASTM C518, Standard Test Method for Steady-State Thermal Transmission Properties by Means of the Heat Flow Meter Apparatus.10 Following thermal testing, samples were dried to establish moisture content and selected samples were checked for thermal performance post drying. Individual data points were collected and included with existing data tables.
| CONSIDER THE TESTING PROCESS |
| It has been said that there are many solutions to a problem. With that wisdom in mind, AEC pros should consider that while multiple products or assemblies may meet pass or fail criteria for minimum assembly performance, such as a weather resistive barrier system, some product property testing may not be an equal comparison when evaluating the components of the assembly. Insulation provides a good example.
The procedures to test liquid moisture absorption of an insulating material may appear to be equal in nature, however closer evaluation of the testing methods used reveal significant difference in performance. For example, an insulating material claiming to deliver “superior water resistance” was tested to ASTM C209 for moisture absorption—requiring submersion of the specimen beneath water for a period of two hours followed by a draining period before weighing to specimen to determine moisture absorption. This resulting number is commonly referred to as simply “moisture absorption” on a product data sheet. However, two other types of rigid foam plastic insulation were tested to ASTM C272. While the process may seem similar—submerging the specimen in water, weighing the specimen and then reporting moisture absorption percentage by weight—the exposure time is significantly increased—from two hours to twenty-four hours and no time is allowed for draining. Based on this example, it is critical to compare not just physical property performance on a data sheet, but the actual test methods referenced in producing those performance results. While the products may both be used in a weather resistive barrier system, one is clearly more susceptible to moisture absorption in the unfortunate event of significantly water exposure or damage to a protective facer. |
Water movement in soil
Water movement through soil is a complicated topic, as movement is tied to factors including soil gradient, moisture content, soil suction, and temperature gradient. Vapor pressure can also be involved in moisture movement. For example, damp soils in cold climates see moisture move upward using capillary action and vapor transport based on the thermal gradient in the ground. Moisture may freeze, prompting frost heaving to occur. Vapor pressure also may push moisture to move, especially in silty or finely grained soil. It may also prompt moisture intrusion into insulation based on the role it plays for moisture absorption in building envelopes. While the work at the University of Alaska focused on the harsh permafrost conditions, a similar phenomenon occurs in Arizona’s notoriously hot climate, as vapor moves upwards through the soil during the day, then cools and condenses beneath the pavement at night.
The understanding of soil mechanics in unsaturated soils has been improving. However, this has yet to be applied to the use of insulation in soil, so questions remain regarding the mechanisms and performance of foam board insulation in below-grade applications in harsh climates. “Soil’s strength is largely a function of its moisture content,” says Connor. “If we understood moisture’s behavior in soil better, we could alter the gradation of soil and manage the moisture moving through it.”
Another challenge of current moisture testing is it does not account for the difference between lateral movement which may occur in walls, versus the more vertical movement taking place as water rises and falls in the ground. Reflecting on the Dalton highway work, Connor stated, “It was really surprising to see how much moisture was sitting on the surface of the insulation, and it got us thinking about how moisture is moving around in the soil.”
Despite the lack of thorough understanding regarding moisture movement through non-saturated soils, testing and examination of the collected insulation samples provided data regarding how much moisture the insulation absorbed throughout its service life.
 [4]
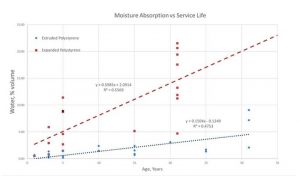
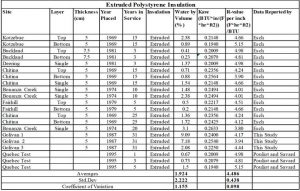
[4]Overall, the EPS insulation was found to collect moisture more quickly and gather more throughout its time in use. For the EPS samples collected across the different periods, the non-weighted average water by volume collected was 9.12 percent. XPS insulation also gathered moisture when left in situation. The non-weighted average of moisture collection for the material was 1.9 percent water by volume. The non-weighted average compares all the samples found without applying significance, or weight, to multiple samples being taken in the same location at the same time. In the XPS samples examined, most water content by volume remained below five percent until the insulation had been in place for 30 or more years. The highest results reached about nine percent after 31 years in place. In contrast, EPS insulation tended to collect more than five percent by volume by the time it had been in place for five years. By the 20-year mark, EPS insulation samples were found to absorb from 10 to 22 percent water by volume.
To better understand how the elements of soil, climate, and moisture level influence moisture uptake into below-grade insulation, it is suggested, unsaturated soil mechanics can be combined with the examination of below-grade insulation. Sensors, such as soil moisture gauges or heat flux meters, could be used to improve the understanding, especially as it relates to R-value performance in different types of soil and over time.
“One of the reasons we keep doing this is because we cannot define what is going on in the soil,” said Connor. “In some of the plotted results, there can be great variability—the variability of moisture uptake from one spot to another can double or triple.” The ongoing research is trying to determine what factors are influencing that variability, he said, adding, “We are struggling to understand why—why are we getting the huge shifts? Is it the insulation or the soil?”
The role of material structure
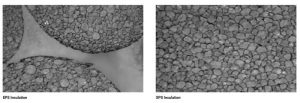
One potential reason for the difference in moisture uptake and retention between the two different types of insulation display is thought to be material structure. Although both EPS and XPS are rigid polystyrene insulations, they do not share the same production process or internal structure.
XPS insulation is generated by mixing the material with a blowing agent and forcing it through a die as the insulation cures. The process generates a consistent, closed-cell structure without leaving internal voids.
However, EPS insulation is comprised of polystyrene beads which expand into a solid material in a mold. Since each bead is initially separate, the combination process can leave internal voids between beads.
 [5]
[5]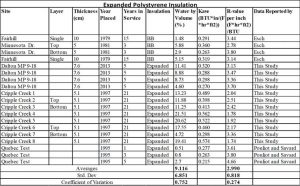 [6]
[6]
EPS insulation may take on water faster because it is able to collect moisture in two ways versus the one of XPS. Several forces, including absorption, capillary action, and gravity may encourage liquid moisture to intrude into EPS insulation, allowing water to gather in the open gaps within the insulation’s structure. It has been posited how this potential collection path was not problematic because the material would drain, however, this does not appear to be occurring in below-grade situations. Vapor drive can also push moisture into the beads of insulation, but this process takes longer. XPS insulation, which lacks internal gaps, is unlikely to see liquid moisture uptake through capillary or gravitational force. However, vapor pressure could force the insulation to collect moisture inside individual cells, which may account for why both types of insulation are found to take on moisture when left below grade for multiple years.
The R-value of insulation over time
Moisture has a high rate of thermal conductivity, and its presence within insulating materials lowers the insulation’s thermal performance or R-value. Some of the additional moisture remains even after the insulation is dried, making it unlikely that the R-value will revert to its initial performance. For example, in EPS insulation, about 24 percent of the moisture collected following 31 years in service remained after the insulation sample was collected and dried. This is potentially a reflection of the drying process being unable to remove moisture from within the closed cells. After 21 years in service, about eight percent of the moisture collected in XPS insulation remained, following the drying process. This potentially supports the inference that most of the moisture gained by the insulation collects in internal voids, which is why EPS collects water more quickly.
 [7]
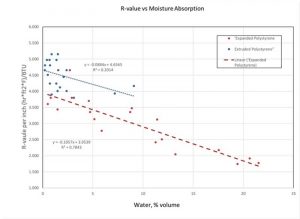
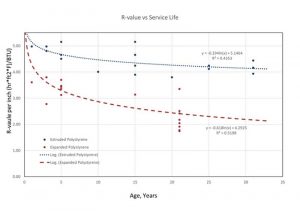
[7]Further testing also demonstrated EPS appears to be more sensitive to moisture in terms of performance than XPS. For both types of insulation, the uptake of moisture is generally linear, as was the decline in R-value during the period examined in the study.
Although there is not always a high degree of correlation between R-value and service life, there is a trend for R-value to decline over time, when exposed to moisture. EPS saw a more rapid decline in R-value before becoming asymptotic to or never quite reaching an R-value of about 2.2 after a 30-year span. XPS insulation saw its R-value decline to almost 4.1 during the same period.
Calculating insulation thickness
Given the discrepancy in moisture uptake, retention, and decline in thermal performance, several different methods of determining the insulation thicknesses needed to provide the intended R-value for a project’s service life have been posited.
One of the main methods created assumes XPS will not see a change in R-value over time but EPS will. This means the necessary amount of XPS is established and the corresponding thickness of EPS is determined using a ratio-based calculation—for this, multiple options have been proposed. For example, if a project needed 101.6 mm (4 in.) of XPS insulation using the average minus one standard deviation multiplier, this 101.6 mm (4 in.) would be multiplied by 1.86 to determine how thick the EPS insulation would need to be. In this example,
188 mm (7.4 in.) of EPS insulation would be needed to match the performance of the XPS insulation.
Although the current study adds data points and additional analysis regarding the performance of rigid polystyrene insulation used in harsh environments in below-grade application, no consensus has been established regarding the best method to determine exactly how thick insulation needs to be for this use.
Two primary pathways based on either the in-service R-value ratio or the in-service reduction in R-value have been created. It is possible for improved understanding of the interaction of insulation with soil-moisture characteristics to further refine the design process. As Connor said, the data suggests, relying on R-values as manufactured may not provide desired performance for a project’s intended lifespan.
Building on the research
The data from the recent University of Alaska study found moisture content within the below-grade applied insulation can vary over time. EPS samples were found to have a maximum moisture content of about 22 percent in a service life of 21 years, based on the age of the oldest samples examined and not overall material function. The XPS insulation was determined to have about nine percent maximum moisture content after 31 years of service, based on the age of samples collected rather than anticipated long-term function of the material. While both insulation types saw a drop in R-value over time, EPS was more sensitive to moisture content and saw a sharper and greater fall in R-value, dropping to 2.2, compared to the 4.1 maintained by XPS.
 [8]
[8]As demonstrated, EPS absorbs more moisture and loses R-value in these below-grade applications, behavior presumed to relate to structural properties and the inability to repel moisture and drain as posited. This resulted in preliminary recommendations of multipliers to account for the performance discrepancies when installing insulation. As a result, specifiers may see multipliers proposed in upcoming code hearings or used in the design of other applications, such as foundations and low-slope roofs, where insulation is similarly exposed to extreme moisture environments.
 [9]
[9]While the research on thermal and moisture performance has been ongoing for more than three decades, the work continues, and more attention is likely to focus on aspects of unsaturated soil mechanics to help predict moisture’s behavior in soil. Insights can help engineers select between options and create better-performing enclosures from below-grade to vegetative roof assemblies. More details on the research and work being conducted in this area are available in the research paper: Comparisons of polystyrene expanded and extruded foam insulation in roadway and airport embankments.
Notes
1 See Permafrost: Everything you need to know, by Denchak, M., NRCD. https://www.nrdc.org/stories/permafrost-everything-you-need-know#sec-where[10]
2 Read How thawing permafrost is beginning to transform the Artic, by Struzik, E., Yale Environment 360. https://e360.yale.edu/features/how-melting-permafrost-is-beginning-to-transform-the-arctic[11]
3 Read The fragile future of roads and buildings built on permafrost, by Baraniuk, C., BBC Future. https://www.bbc.com/future/article/20210303-the-unsure-future-of-roads-and-buildings-on-melting-ground[12]
4 Consult Building in permafrost country: A challenge of technology, cost, and a warming climate, by Currey, J., Alaska Department of Transportation and Public Facilities. https://dot.alaska.gov/traveltopics/building-in-permafrost.shtml[13]
5 Consult Comparison of polystyrene expanded and extruded foam insulation in roadway and airport embankments. (Report No. INE/AUTC 19.08), by Connor, B., Alaska University Transportation Center.
6 Consult Insulation performance beneath roads and airfields in Alaska (No. FHWA-AK-RD-87-17), Esch, D. C., Department of Transportation and Public Facilities.
7 Read High Density Expanded Polystyrene Boards as Road Insulation, Phase I, Performance Evaluation of Expanded Polystyrene on Road 161 in Saints-Martyrs-Canadiens, by Pouliot, N., & Savard, Y., Performance Follow-Up Report, Quebec: Ministry of Transport, Quebec.
8 See Review of moisture behavior and thermal performance of polystyrene insulation in building applications, by Cai, S., Zhang, B., & Cremaschi, L., Building and Environment, 123, 50–65. https://doi.org/10.1016/j.buildenv.2017.06.034[14]
9 Consult Standard Test Method for Water Absorption of Rigid Cellular Plastics (ASTM D2842-19), ASTM International, https://www.astm.org/d2842-19.html[15]
10 Consult Standard Test Method for Steady-State Thermal Transmission Properties by Means of the Heat Flow Meter Apparatus, ASTM International, https://www.astm.org/standards/c518[16]
 Author
- [Image]: https://www.constructionspecifier.com/wp-content/uploads/2022/12/Opener.jpg
- [Image]: https://www.constructionspecifier.com/wp-content/uploads/2022/12/Figure-1.jpg
- [Image]: https://www.constructionspecifier.com/wp-content/uploads/2022/12/Figure-2.jpg
- [Image]: https://www.constructionspecifier.com/wp-content/uploads/2022/12/Figure-3.jpg
- [Image]: https://www.constructionspecifier.com/wp-content/uploads/2022/12/Chart-1_ART-PLEASE-RECREATE.jpg
- [Image]: https://www.constructionspecifier.com/wp-content/uploads/2022/12/Chart-2_ART-PLEASE-RECREATE.jpg
- [Image]: https://www.constructionspecifier.com/wp-content/uploads/2022/12/Figure-4.jpg
- [Image]: https://www.constructionspecifier.com/wp-content/uploads/2022/12/Figure-5.jpg
- [Image]: https://www.constructionspecifier.com/wp-content/uploads/2022/12/Chart-3_ART-PLEASE-RECREATE.jpg
- https://www.nrdc.org/stories/permafrost-everything-you-need-know#sec-where: https://www.nrdc.org/stories/permafrost-everything-you-need-know#sec-where
- https://e360.yale.edu/features/how-melting-permafrost-is-beginning-to-transform-the-arctic: https://e360.yale.edu/features/how-melting-permafrost-is-beginning-to-transform-the-arctic
- https://www.bbc.com/future/article/20210303-the-unsure-future-of-roads-and-buildings-on-melting-ground: https://www.bbc.com/future/article/20210303-the-unsure-future-of-roads-and-buildings-on-melting-ground
- https://dot.alaska.gov/traveltopics/building-in-permafrost.shtml: https://dot.alaska.gov/traveltopics/building-in-permafrost.shtml
- https://doi.org/10.1016/j.buildenv.2017.06.034: https://doi.org/10.1016/j.buildenv.2017.06.034
- https://www.astm.org/d2842-19.html: https://www.astm.org/d2842-19.html
- https://www.astm.org/standards/c518: https://www.astm.org/standards/c518
Source URL: https://www.constructionspecifier.com/dispatch-from-alaska-insights-on-moisture-soil-and-material-performance/