

by Helen Sanders, PhD
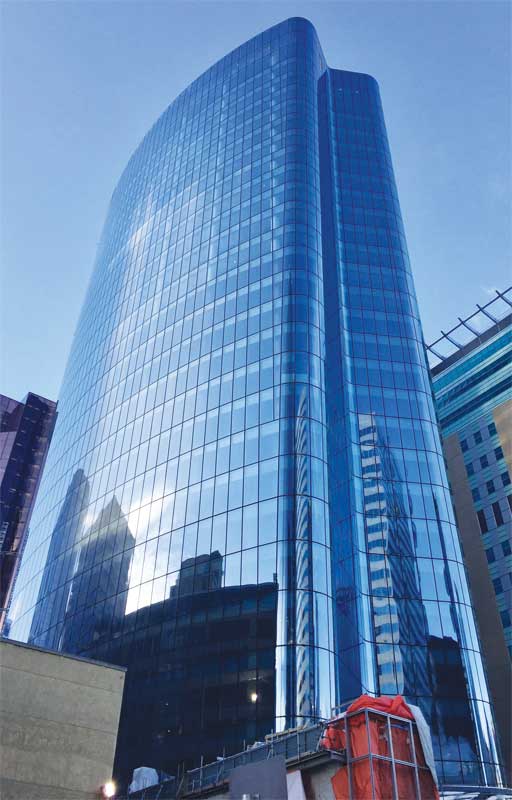
Highly glazed assemblies allow for daylight and views, but poor fenestration can also lead to thermal comfort issues, a reduction in the façade’s overall thermal performance, and condensation problems leading to indoor air quality (IAQ) impacts. Over the years, the industry has heavily relied on increasing performance of low-emissivity (low-e) coatings to drive down window U-factors (thermal transmittance). However, the center-of-glass (COG) U-factor, which is influenced by low-e coating performance, is only part of the picture. Achieving
the lowest transmittance requires looking more broadly at the window as a system. The full thermal performance is determined not only by COG, but also by the conductance of the frame and the edge of glass (EOG), as well as aspects related to air leakage and installation. (The author would like to thank Ahoo Malekfazali for her help in providing EnergyPlus modeling data, YKK-AP for providing images for Hyatt House Naples, and Steve LeBlanc from Contract Glaziers for having provided images of the Manulife building.)
When specifying fenestration, the goal is to improve the thermal performance of the frame and EOG first, since high performance on the perimeter enables flexibility in glass package specification and ensures the COG performance will have the greatest impact. As this article explores, polyamide strips can be used to reduce heat transfer across aluminum frames. Additionally, warm-edge insulating glass (IG) spacers can provide a reliable 0.02 to 0.03-Btu/F•hr•sf reduction in overall window U-factor and improve a window’s condensation resistance.
U-factor: The whole window versus center of glass
The thermal transmittance (U-factor) of a window is the area-weighted average of the thermal transmittances of the frame, EOG, and COG. Figure 1 shows a section of an aluminum frame and EOG. The former comprises the opaque elements holding the glass, while the latter is the perimeter area of the IG unit (IGU) containing the spacer and sealants. (The COG comprises the vision area of the glazing.) Due to the area weighting, the frame and edge seal thermal transmittance dominate the overall U-factor in smaller windows where the ratio of center of glass to window perimeter area is low.
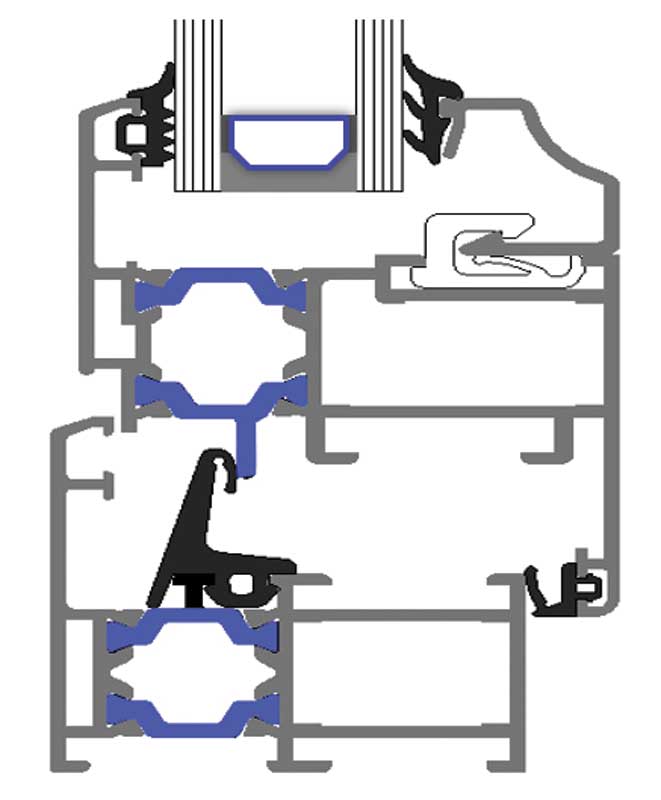
Images courtesy Technoform North America
The National Fenestration Rating Council (NFRC) uses standard sizes for different fenestration types (e.g. fixed window, awning, and skylight) to allow comparisons between different systems of the same fenestration type. Figure 2 shows whole-unit and COG U-factor data for a selection of NFRC-rated window wall products. The data illustrates the very large difference between COG U-factor and corresponding whole-window U-factor for a range of glazing infills in both a non-thermally broken frame and a thermally broken frame. The whole-window U-factor is always considerably higher than the COG value. For the non-thermally broken frame, the difference between the whole-unit and COG U-factors is in the range of 0.15 to 0.18 Btu/F•hr•sf; in some cases, the whole-unit value is more than twice the COG value.
The data also illustrates how vital it is to ensure the correct fenestration system U-value is specified and the COG value is not mistaken for the whole-system U-factor, especially when used for energy modeling. If the COG U-factor is used in an energy model to represent the full fenestration performance, the energy use intensity (EUI) calculated for the building will be lower than it should be based on the specified fenestration package.
For example, employing the U.S. Department of Energy’s (DOE’s) EnergyPlus modeling software, a ‘shoe box’ analysis of a simple 5 m deep x 8 m wide x 3 m high (16 x 25 x 10 ft) perimeter zone with 70 percent window area in a Minneapolis building shows the calculated perimeter zone EUI is between four and five percent too low, irrespective of glazing orientation, if a COG value of 0.30 Btu/F•hr•sf is used rather than the full fenestration value of 0.45.
The estimated heating energy per elevation is underestimated by an even larger amount (i.e. seven percent), which could result in under-sizing of heating system capacity. Assuming this impact is additive across all elevations where the mistake is made, the underestimation of building energy performance is significant. Indeed, modeling the perimeter zone of a prototypical building in Minneapolis with 70 percent glazed area on all orientations showed using a U-factor of 0.30 instead of 0.45 would lead to an underestimate of perimeter zone EUI of 15 percent. Such mistakes affect code and certification compliance, as well as as-built energy and occupant comfort performance. (According to modeling experts, such errors are not uncommon—specifying American Society of Heating, Refrigerating, and Air-conditioning Engineers’ [ASHRAE’s] Building Energy Modeling Professional [BEMP] certification can help circumvent these issues. For more information, visit www.ashrae.org/education-certification/certification/bemp-building-energy-modeling-professional-certification.)
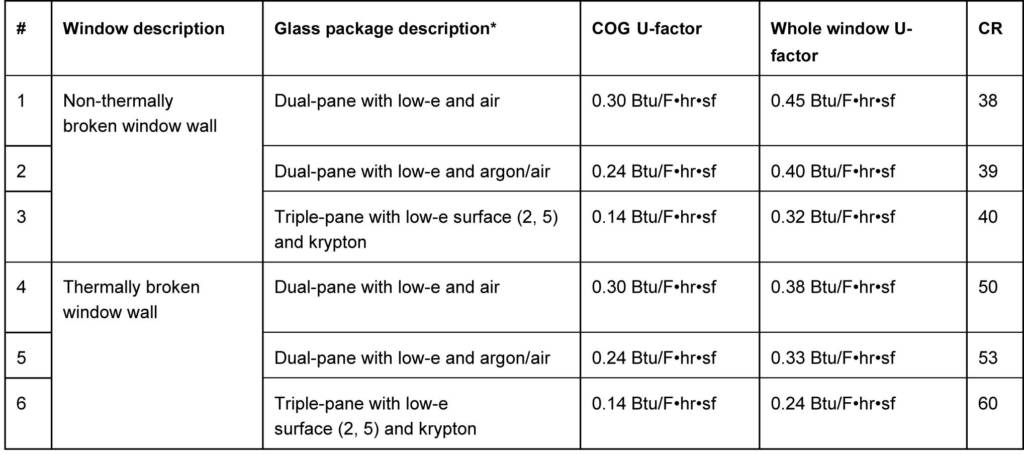
The above table provides a comparison of center-of-glass (COG) U-factor, whole-window U-factor, and National Fenestration Rating Council’s (NRFC’s) condensation resistance (CR) for six different window wall systems. This data comes from an NFRC database information for two proprietary window wall products.

