

Transmission loss testing
As stated earlier, the decibel scale is logarithmic and not linear. Consequently, SPLs cannot be added or subtracted linearly. For example, some specifications call for minimum transmission losses (TL) in specific full-octave frequency bands. However, test results are reported in third OBs. To average three tested data points for checking compliance, the following formula is used:
TLOB =
10 x 10.5 – {log[(10(10-(TL1/10)) + (10(10-(TL2/10)) + (10(10-(TL3/10 ))]}
Where:
TLOB = octave band transmission loss;
TL1 = transmission loss of the lower third octave band;
TL2 = transmission loss of the center third octave band; and
TL3 = transmission loss of the upper third octave band.
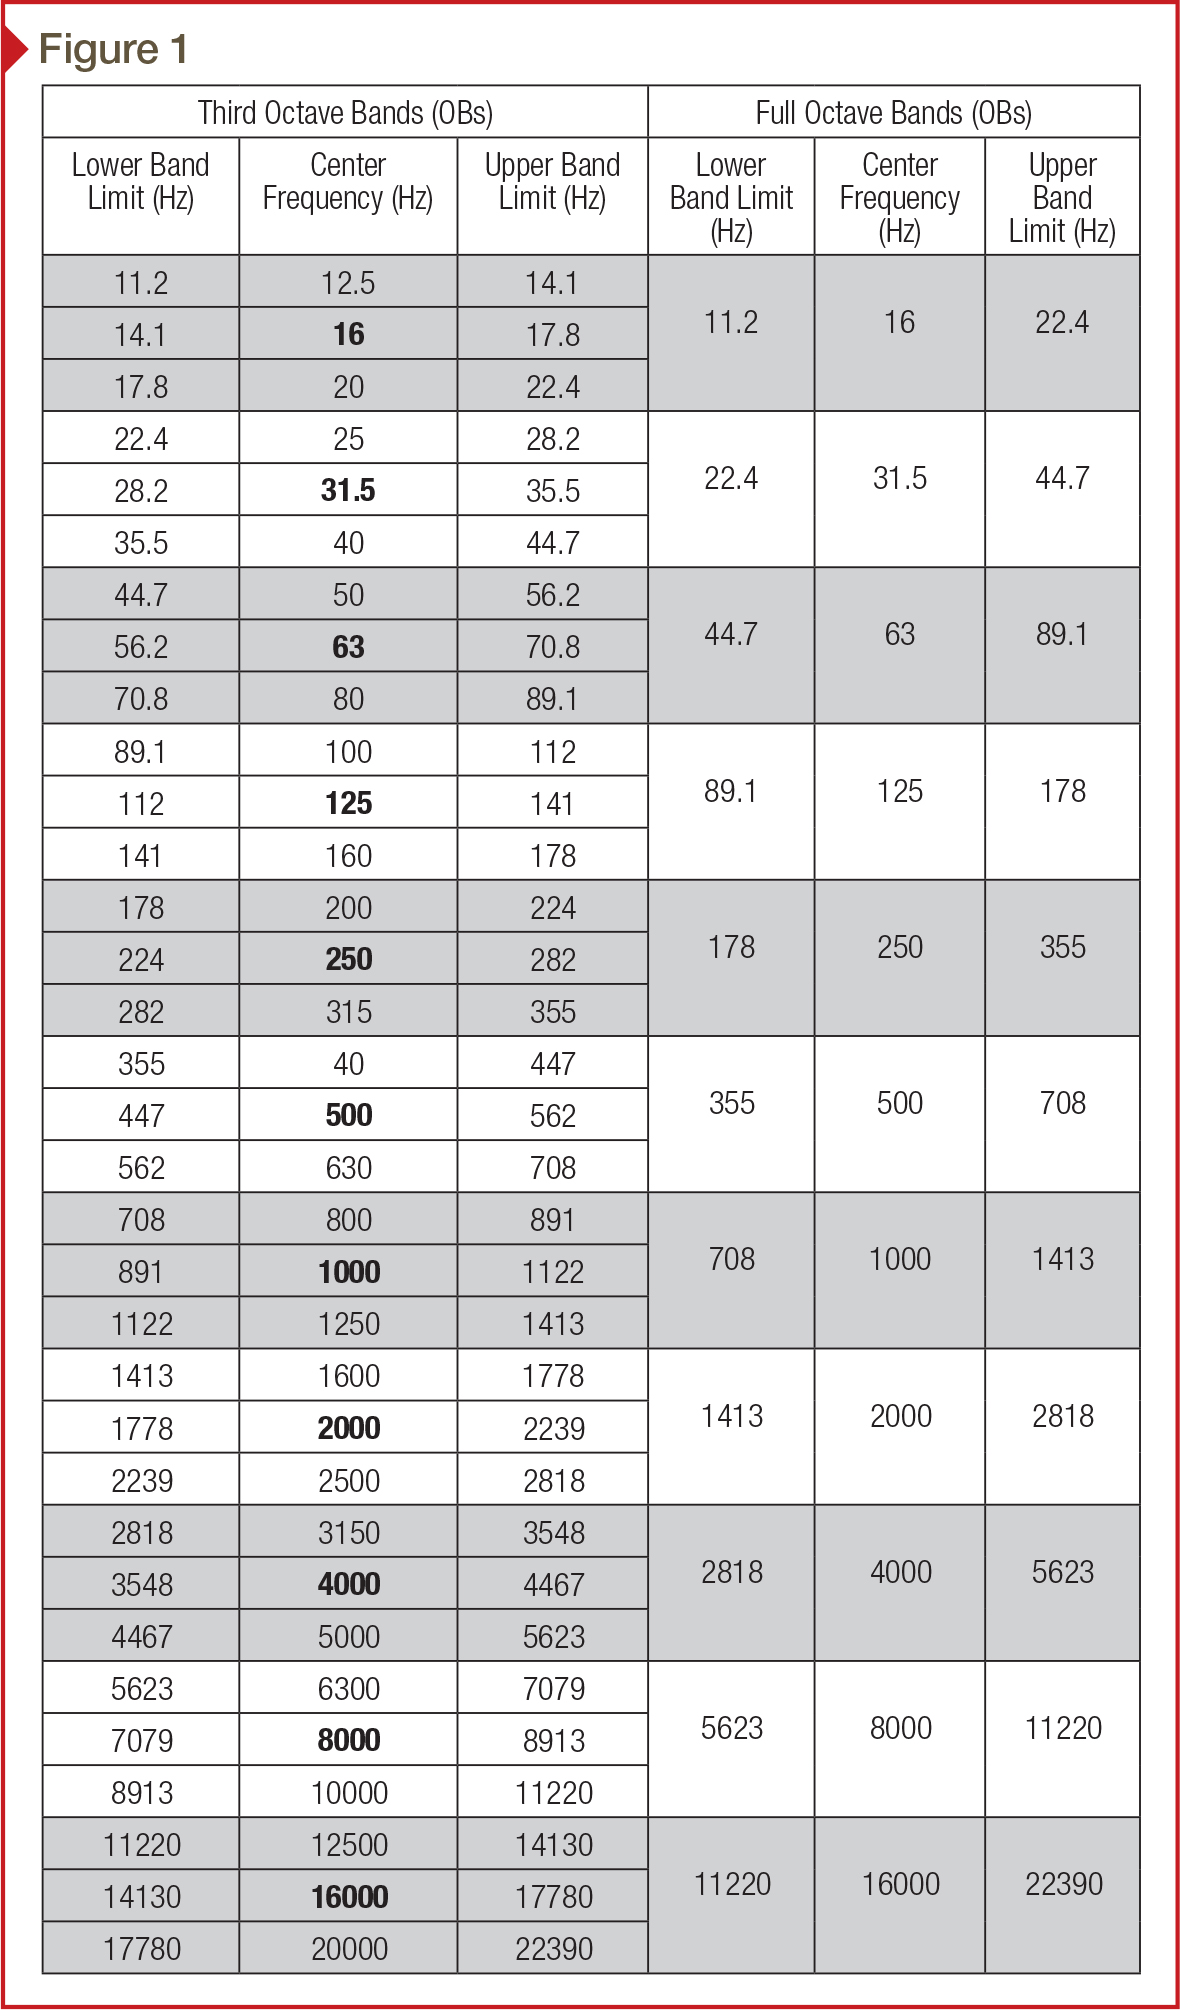
Figure 1 lists the third OB groupings and the full octave groupings.
Technically speaking, lower noise levels are factored into calculations, but in practice, “total noise” is dependent only on the loudest source of many. An 80-dB sound is twice as loud as a 70-dB sound. (This is due to the exponential difference in sound pressure level (SPL) implied by the decibel (dB) scale.) Performance is governed by the weakest link—in other words, a 70-dB sound will be almost completely drowned out by an 80-dB one. An opaque wall transmitting 30 dB will make little difference to the occupants of a room in which the window transmits 40 dB. Small differences of less than 3 dB in SPL, TL, sound transmission class (STC) or outdoor/indoor transmission class (OITC) barely are perceptible to normal human hearing.
Acoustic test chambers in U.S. laboratories consist of two reverberant rooms—a source room and a receiving room. A high-transmission-loss filler wall separates these rooms. The test specimen, whether glass-only or a composite frame/glass assembly, is mounted in an opening in this filler wall. The sound-transmission loss tests are conducted in accordance with ASTM E90, Standard Test Method for Laboratory Measurement of Airborne Sound Transmission Loss of Building Partitions and Elements.
Loudspeakers in the source room generate broadband noise in third OBs, at frequencies ranging from 80 to 5000 Hz. Microphones connected to a data-collection system will measure SPLs within the receiving room, providing the measured values used to calculate TL provided by the test specimen. TL data are plotted on a logarithmic axis with respect to the third OB frequencies to create a TL curve.
When needed for project specifications, this TL curve is usually converted to a single-number rating, either STC or OITC.
Sound transmission class
Originally developed for interior wall partitions, the STC rating is determined per ASTM E413, Classification for Rating Sound Insulation. It involves fitting a pre-defined standard contour curve to the measured TL curve. STC is a single-number rating system for acoustic performance, developed primarily for typical interior noise frequencies, and is the most commonly specified measure of acoustic performance. The higher the STC, the more sound a given partition blocks.
STC is determined by a three-step process:
1. Test the glazed window assembly in a highly insulated test buck, generating a TL curve that characterizes overall performance.
2. Overlay the criterion curve best representing the TL data. This ‘best fit’ is defined as no more than 32 dBA of total ‘deficiencies’ between the criterion curve and specimen TL curve, and no more than a 8-dBA deficiency at any one third OB.
3. STC is reported as the criterion curve TL at 500 Hz.
Due to the peculiarities in this calculation methodology, there may be very little difference in tested performance between a ‘strong’ STC of 35 and a ‘weak’ STC of 37. STCs of 48 or higher are past the point of diminishing returns for window and curtain wall improvements, and can be very expensive to achieve.

