Illustrating the Dew Point: An effective way to determine its value
by Katie Daniel | July 18, 2017 10:00 am
 [1]
[1]by Anthony Katona, CDT
Although many roof designers and construction professionals understand the basic meaning of the Dew point temperature, there remains a real need for greater awareness about how to accurately perform and demonstrate the necessary calculations. This author’s preferred method is to graphically illustrate the process. This allows one to accurately determine the value in relation to above-deck insulated, low-slope built-up roofing (BUR) assemblies.
Relied on by architects, engineers, HVAC designers, and roof consultants alike, the dew point is defined by the National Roofing Contractors Association (NRCA) as “the temperature at which air becomes saturated with water vapor; the temperature at which air has a relative humidity (RH) of 100 percent.” In other words, it is the point when water vapor condenses and changes from a vapor to a liquid.
 [2]
[2]Image courtesy Professional Roofing
According to NRCA, dew point calculations are necessary whenever the outside average January temperature is below 4 C (40 F), and when the expected interior winter RH is 45 percent or greater. Average exterior temperature can be determined from historical climatic data compiled by either the National Weather Service or local private weather services. When local climatic data is unavailable, the map in Figure 1 can be used to determine the general regions with outside January temperature below 4 C.
NRCA considers the roof system designer to be responsible for determining whether a vapor retarder is necessary. When dew point calculations have not been correctly performed before construction, this often results in a liability. Additionally, costs can be significant when the calculations must be conducted in the field after the fact. Therefore, understanding how to calculate dew point is critical.
For this article, the step-by-step procedures presented use hypothetical constant temperature values. However, actual dew point temperatures and related RH values constantly change in typical building environments. Therefore, this author recommends any findings be confirmed using methods advocated by NRCA. In the event a vapor barrier is required, further support can be obtained from the U.S. Army Corps of Engineers’ (USACE’s) Cold Regions Research and Engineering Laboratory (CRREL) and the American Society of Heating, Refrigerating, and Air-conditioning Engineers (ASHRAE). (Vapor barriers and vapor retarders are not synonymous. The former is a layer of material[s] used to prevent the transfer of moisture, primarily in the form of vapor, from permeating into adjacent materials within a building environment. A vapor retarder is a layer of material[s] used to prevent the transfer of water vapor, primarily in the form of liquid, from permeating into adjacent materials or anywhere within a building structure.)
 [3]
[3]
Roofing assemblies create varying degrees of barriers between areas of differing vapor pressures. Therefore, if a roof is insufficiently insulated, warm, moist air will rise into the assembly above, where it can cool to its dew point temperature, creating the necessary conditions for condensation to occur. The rate at which the air cools depends on the R-value of the material it is passing through, with the choice and thickness of insulation having the greatest impact.
Vapor drive from interior to exterior is likely to be strongest when the exterior temperature and RH are low and the interior temperature and RH are high. These conditions occur most often during winter months in cooler regions, as warmer interior air exerts a higher vapor pressure than cooler air outside.
The primary goal of the method explored in this article is to establish the conditions at the warm side of the vapor retarder (i.e. the underside), where it must remain warmer than the dew point temperature of the entire roof assembly. This article uses as its central example an assembly including an above-deck rigid polyisocyanurate (polyiso) insulation board—a material chosen because of its high thermal resistance or R-value (per inch of thickness).
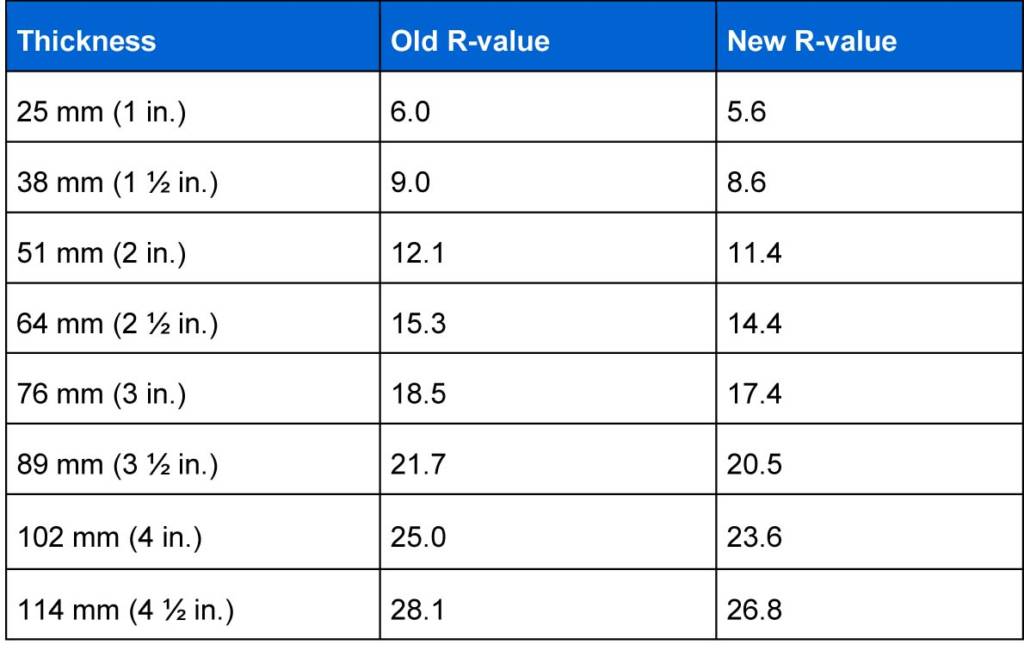
Additionally, for this article, this author calculates the dew point temperatures using the recently updated long-term thermal resistance values (LTTR). These R-values, which are based on ASTM C1289-11A, Standard Specification for Faced Rigid Cellular Polyisocyanurate Thermal Insulation Board, became effective on January 1, 2014. LTTR values predict product R-value after five years, which is equivalent to a time-weighted thermal design R-value for 15 years (Figure 2).
A practical example
The first step in this process is to create a list of the components being evaluated. In this article’s example, there are eight individual components comprising the roof assembly necessary to develop an accurate R-value profile:
- exterior air film;
- five-ply BUR roof system with a covering of embedded fly-ash slag ballast;
- 12-mm (½-in.) thick high-density (HD) insulation coverboard;
- 64-mm (2 ½-in.) thick layer of rigid polyiso insulation board;
- three-ply BUR vapor retarder;
- compatible HD vapor retarder substrate;
- 22-gauge (Type B) steel roof deck; and
- interior air film.
(For an expanded illustration of the individual components, see Figure 3.)
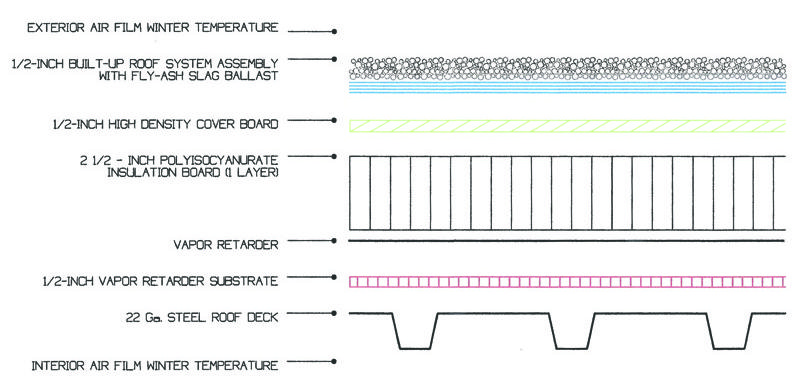 [4]
[4]Images courtesy Anthony Katona
The actual BUR portion of this article’s roof system consists of one ply of asphalt-coated, fiberglass base-sheet type #30, and four plies of Type IV fiberglass asphalt interply felt. The vapor retarder is similar—one ply of the former and two plies of the latter. Each ply is set into a full mopping of Type IV hot asphalt.
Each component of these manufactured goods meets its respective ASTM standard:
- ASTM D4601, Standard Specification for Asphalt-coated Glass Fiber Base Sheet Used in Roofing;
- ASTM D2178, Standard Specification for Asphalt Glass Felt Used in Roofing and Waterproofing; and
- ASTM D312, Standard Specification for Asphalt Used in Roofing.
The composition of the roofcovering in this example consists of a gravel surfacing of fly-ash slag ballast meeting ASTM C1289. The slag has been broadcast and embedded into a complete flood coat of Type IV hot asphalt meeting ASTM D312.
Determining dew point requires selecting a specific geographical location with a known value of the exterior design dry-bulb temperature (i.e. temperature of air as measured by an ordinary thermometer) for winter, as this is when the warm air is most likely to be rising through the roof assembly. This data can be found in Appendix 3 (“Climate/Design Data”) of NRCA’s Roofing and Waterproofing Manual, fifth edition. This article’s hypothetical example is located in Allentown, Pennsylvania—selected because this geographic local meets the design criteria used throughout the article.
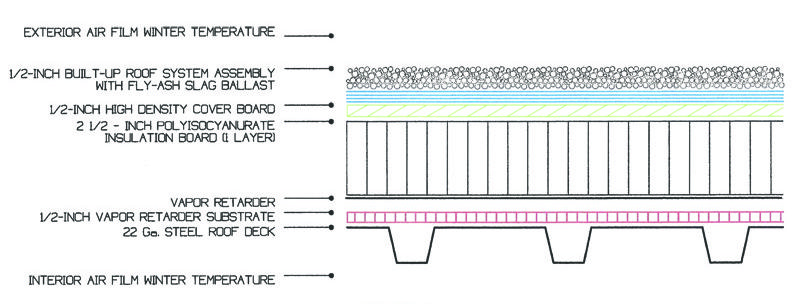 [5]
[5]Determining the R-values
The next step involves determining the actual R-value of each individual product or material being called for in the assembly, as every building material has distinct thermal resistance properties.
Typical thermal properties of common building materials can be found in the “Moisture Control” section of NRCA’s Roofing and Waterproofing Manual or Chapter 25 (“Thermal & Water Vapor Transition Data”) of the 2001 ASHRAE Handbook–Fundamentals. Due to limitations, some of the values for individual components were obtained via multiple online searches. (Websites visited to establish R-values of various individual components include www.sizes.com[6], www.cmfac.groups.et.byu.net[7], www.coloradoenergy.org[8], www.courses.washington.edu[9], www.gpgypsum.com[10], www.inspectapedia.com[11], and www.archtoolbox.com[12].)
During this process, it is important to note air film exists on both the interior and exterior sides of the roof assembly. This air film has an R-value contributing to the assembly’s overall R-value. It is also important to note there are different R-values for interior and exterior air films during winter and summer months. The R-values of the individual components used in this example are:
- interior air film (winter) design temperature: 0.68;
- 22-gauge (Type B) steel roof deck: 0.00;
- HD roof vapor retarder substrate: 0.56;
- three-ply BUR vapor retarder: 0.12;
- 64-mm (2 ½-in.) polyiso rigid insulation board: 14.40;
- 12-mm (½-in.) thick HD insulation roof coverboard: 0.56;
- five-ply BUR roof system with fly-ash slag aggregate covering: 1.52; and
- outside air film (winter) design temperature: 0.17.
Arriving at the R-value of the entire construction assembly involves adding together the value of each individual component. In this case, the total R-value of the entire roof assembly is 18.01.
At this point, one must keep in mind the importance of computing the necessary mathematical calculations to avoid undesirable conditions that would support the growth of mold and mildew and/or the accumulation of unwanted moisture within the roof system assembly. However, in establishing the correct design dew point temperature, it is vital to remember several influencing factors, including:
- all indicated R-values and dew point temperatures are subject to change along with the pattern of the four seasons and local weather conditions;
- every building structure has its own unique R-value based on the geographical location and the materials used during the actual construction process; and
- improper ventilation, insufficient insulation, and improperly installed vapor retarders all impact design conditions.
One method preferred by many architects, engineers, HVAC system designers, and roof consultants to accomplish this task is to graphically illustrate a drawing of the roof system assembly being proposed. All temperatures are measured at the top side of each component, and are plotted on the drawing as closely as possible to that position, with the actual illustrations drawn in a proportion large enough to clearly display the various components (Figure 4).
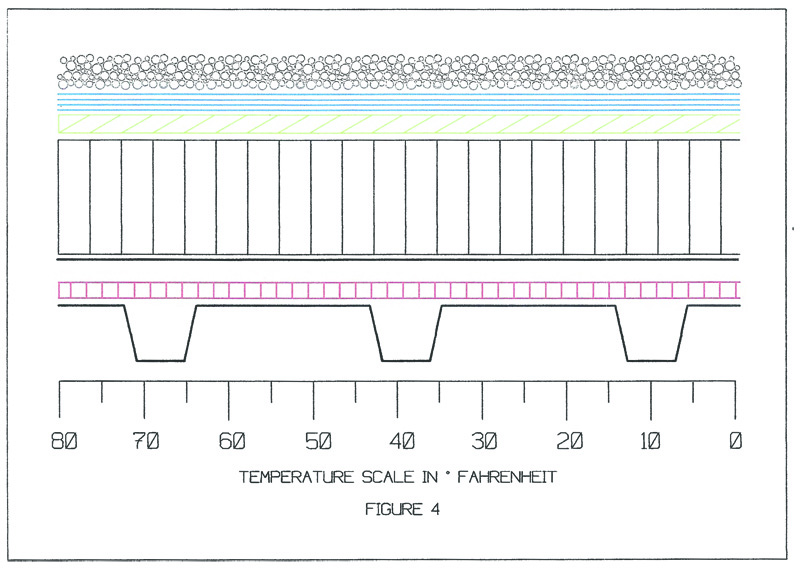 [13]
[13]Performing the calculations
Having a working knowledge of all the materials covered thus far in this article, one can now begin the actual steps to perform the calculations, plot the coordinates, and then determine the dew point temperature.
Step 1: Determine the winter (interior) design dry-bulb temperature
This value should come from the HVAC system designer or, for an existing building, either a knowledgeable maintenance engineer or the person maintaining the HVAC and mechanical control systems. For this example, the winter (interior) design dry-bulb temperature is 22.88 C (75 F).
Step 2: Determine the winter (exterior) design dry-bulb temperature
This design value can be found in Appendix 3 (“Climate/Design Data”) of NRCA’s Roofing and Waterproofing Manual (fifth edition) or in Chapter 27 (“Climatic Design Information”) of the 2001 ASHRAE Handbook–Fundamentals. For Allentown, Pennsylvania, the winter (exterior) design dry-bulb temperature is −15.5 C (4 F).
Step 3: Illustrate the roof assembly and plot all individual R-values using the temperature scale beneath the diagram
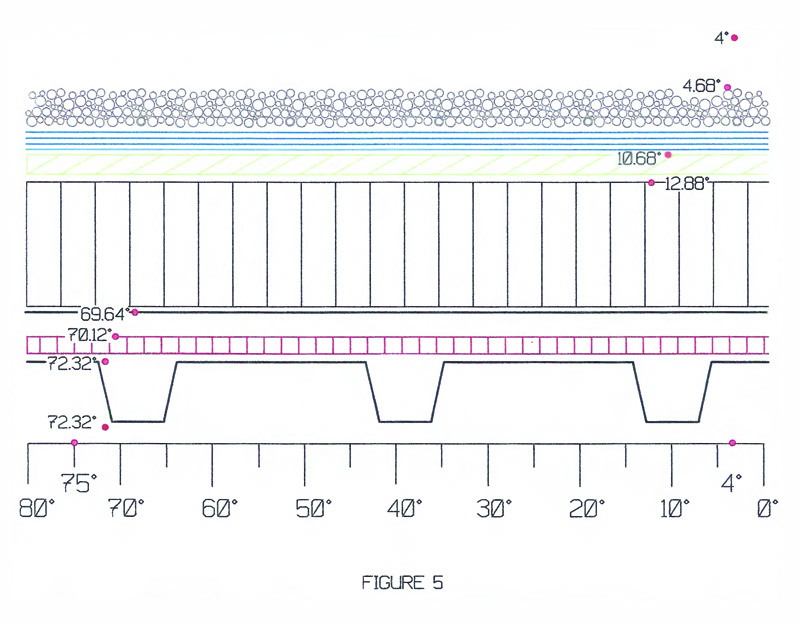
The starting temperature on the left side of the scale will be the winter interior dry-bulb design temperature. The scale will end on the right side with the winter exterior dry-bulb temperature value. Then, evenly spaced vertical lines are inserted to represent five- and 10-degree increments on the temperature scale (Figure 5).
Step 4: Calculate the heat loss occurring at each material
As shown in Figure 6, this step is accomplished using the fundamental heat-loss formula:
Temperature drop = Ti – [(R/Rt) x ΔT]
Where:
Ti = design interior temperature (in Fahrenheit);
ΔT = (winter interior design dry-bulb temp [75]) – (winter exterior design dry-bulb temp [4]) = 71;
R = cumulative R-values of materials starting from the interior air film; and
Rt = total R-value of the entire roof assembly, which was previously determined to be 18.01.
Step 5: Perform the mathematical equations
The next step is to begin the process of carrying out the actual mathematical equations, starting with the interior air film as the first calculation.
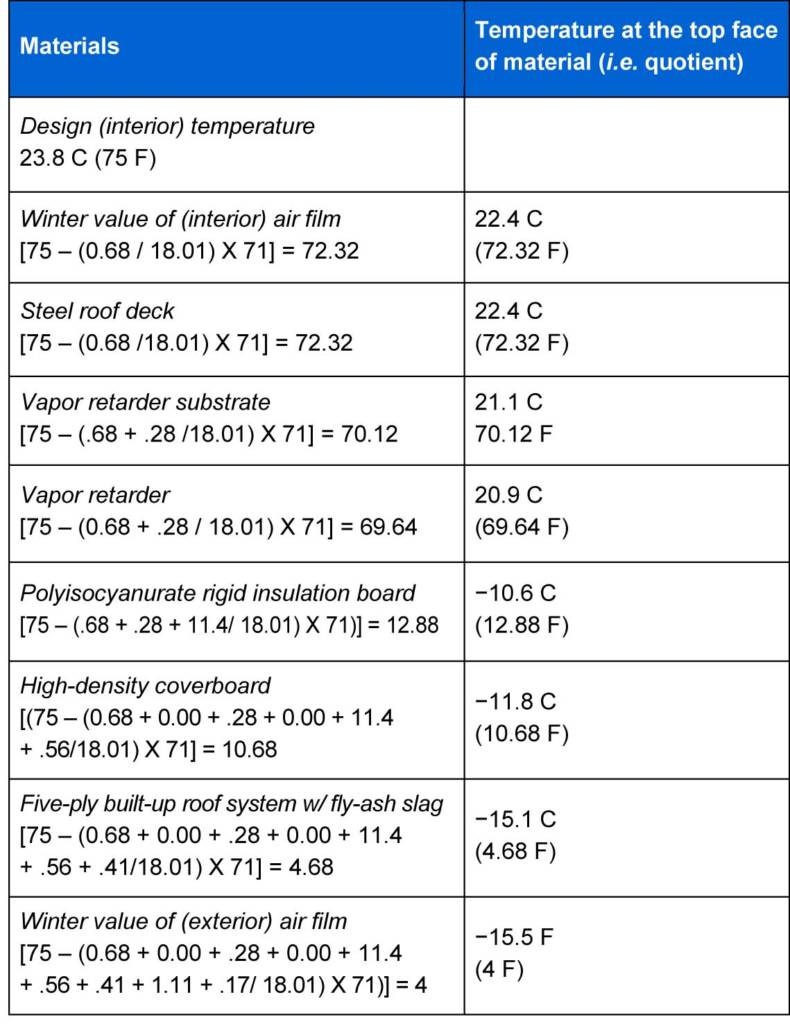 [14]
[14] 1. Interior air film R-value: .68
[75 – (.68 / 18.01) x 71]
75 – (.037 x 71)
75 – 2.68 = 72.32 F
2. Metal deck R-value: .00
[75 – ([.68 + .00 / 18.01] x 71)]
75 – (.037 x 71)
75 – 2.68 = 72.32 F
3. Vapor retarder substrate R-value: .56
[75 – ([.68 + .00 + .56 / 18.01] x 71)]
75 – (0.68 x 71)
75 – 4.88 = 70.12 F
4. Vapor retarder R-value: .12
[75 – ([.68 + .00 + .56 + .12 / 18.01] x 71)]
75 – (.075 x 71)
75 – 5.36 = 69.64 F
5. Polyiso insulation board R-value: 14.4
[75 – ([.68 + .00 + .56 + .12 + 14.4/ 18.01] x 71)]
75 – (.875 x 71)
75 – 62.12 = 12.88 F
6. High-density coverboard R-value: .56
[75 – ([.68 + 0.00 + .56 + .12 + 14.4 + .56/18.01] x 71)]
75 – (0.906 x 71)
75 – 64.32 = 10.68 F
7. Multi-ply BUR with fly-ash slag ballast R-value: 1.52
[75 – ([0.68 + 0.00 + .56 + .12 + 14.4 + .56 + 1.52/18.01] x 71)]
75 − (.990 x 71)
75 – 70.32 = 4.68 F
8. Exterior air film R-value: .17
[75 – ([0.68 + 0.00 + .56 + .12 + 14.4 + .56 + 1.52
+ .17/ 18.01] x 71)]
75 – (1.00 x 71)
75 – 71 = 4 F
Step 6: Plot the temperature gradient values for each material onto a roof assembly drawing
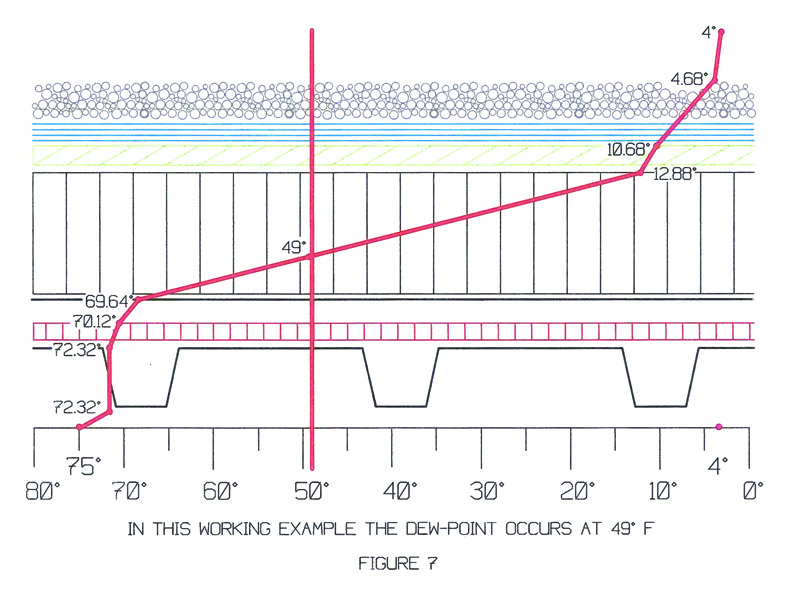
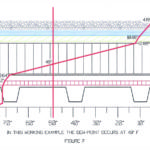
In completing this step, it is important to remember each temperature value determined in the previous step must be located at the top surface of the material layer (Figure 7).
Step 7: Draw a line from the interior temperature to the next value and continue connecting the plotted temperature values until the line reaches the exterior design temperature This step is illustrated in Figure 8.
Step 8: Determine the dew point temperature
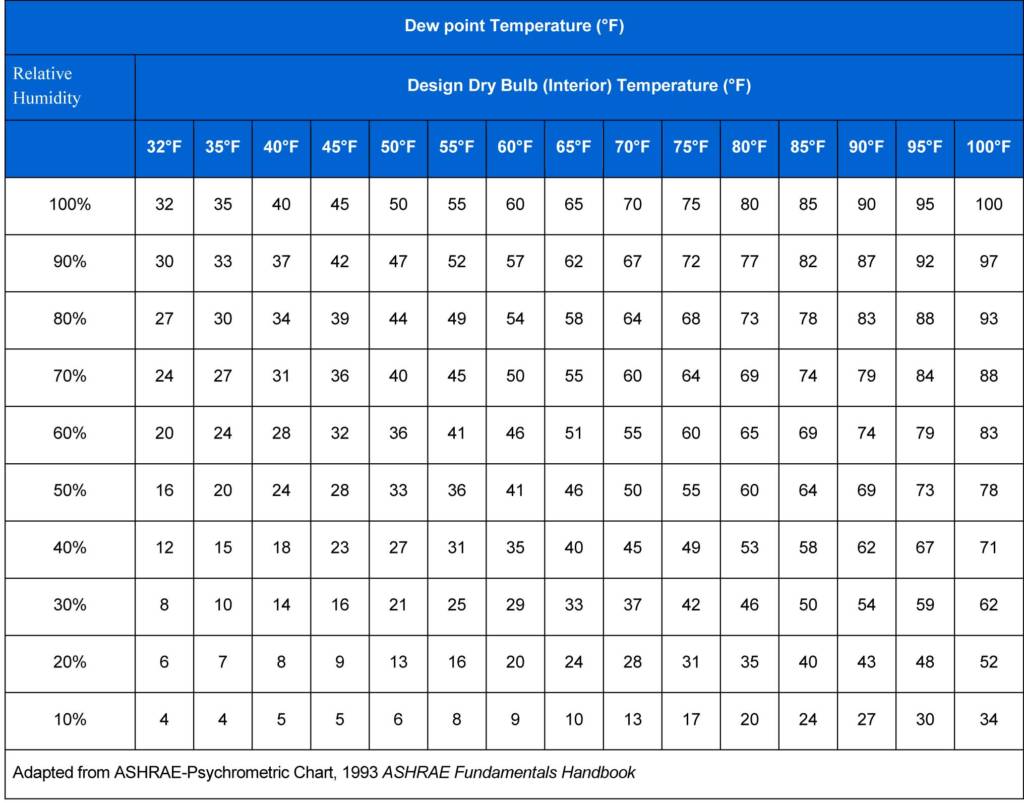
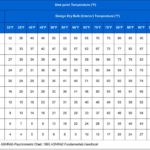
This can be determined by using a variation of the ASHRAE Psychrometric Chart shown in Figure 9. The dew point temperature occurs at the intersection of the design dry-bulb temperature column and the RH row. In this example, the dew point temperature is 49 F (i.e. 9.44 C).
In this working example, 75 F (i.e. 22.88 C) is the dry bulb (interior) temperature and 40 F (i.e. 4 C) is specifically listed as a relative humidity, so no linear interpolation is necessary. Returning to the graphic illustration of the roof assembly, the dew point temperature value can now be plotted and located on the temperature gradient line (Figure 10)
When the dew point temperature falls within the insulation placed above the vapor retarder, condensation should not occur on the bottom of the vapor retarder. However, if the dew point falls below the insulation, additional insulation is required.
Items to consider
When additional insulation is required, a new amount of the material is selected and the steps are performed again to determine whether the dew point temperature falls within the insulation. Additionally, if the dew point temperature falls within the upper portion (around the upper one-third of the insulation), the amount of insulation may be reduced if the dew point stays within and the quantity meets building code requirements. (Again, one would go through all the steps with the new amount of insulation to ensure acceptable dew point temperature results.)
Actual RH and dew point temperature values constantly change in typical building environments as the ambient temperature and/or water vapor pressure in the air change.
An HVAC system designer typically determines design values to size the equipment for the building envelope thermal insulation and water vapor control. These design values are most often based on anticipated maximum extreme conditions.
On a related note, it is important to stagger all the insulation boards, vapor retarder substrate, and high-density coverboard a minimum of 150 mm (6 in.) in all directions during installation in order to eliminate thermal bridging.
Conclusion
Why is it necessary to develop an illustration of the dew point in graphic detail? Creating the graphic illustration explored in this article is helpful to the designer in several ways. For example:
- It can help establish whether a vapor retarder is necessary during the design phase of an above-deck insulated roof system.
- It gives the designer a visual perspective of where the temperature of the dew point falls within a visual mockup of the roof system assembly.
- Once the graphic illustration is completed, one can use the information to determine whether the design calls for either adding to or subtracting from the amount of insulation proposed for use above the vapor retarder. This aspect not only allows the designer to determine the proper position of the dew point within the roof assembly, but
it also visually affords the designer the ability to determine whether the dew point temperature falls below the warm side of the vapor retarder, thereby avoiding the potential for a catastrophic loss. - It also gives the designer the ability to evaluate whether the proposed design calls for the installation of too much insulation above the vapor retarder. This evaluation can result in a significant cost savings.
| Further discussion… |
| After this article was published in the July 2017 issue of The Construction Specifier, a reader had concerns regarding the calculation. To read the letter and see the author’s response, click here[17]. |
Anthony Katona, CDT, is the president of Alliance Roof Consultants Inc., and has been providing professional services as a building envelope and commercial roof consultant since 1999. With construction experience spanning nearly 30 years, he has an extensive background in building envelope and commercial roof consulting, along with general contracting. Katona has served as a member of the Editorial Advisory Board of The Construction Specifier. He can be reached
at alliancerc@comcast.net[18].
- [Image]: https://www.constructionspecifier.com/wp-content/uploads/2017/07/bigstock-Gravel-Flat-Roof-109414772-e1500308698591.jpg
- [Image]: https://www.constructionspecifier.com/wp-content/uploads/2017/07/Figure-1.jpg
- [Image]: https://www.constructionspecifier.com/wp-content/uploads/2017/07/Figure-2-edit.jpg
- [Image]: https://www.constructionspecifier.com/wp-content/uploads/2017/07/Figure-2-e1500313429200.jpg
- [Image]: https://www.constructionspecifier.com/wp-content/uploads/2017/07/Figure-3-e1500313633106.jpg
- www.sizes.com: http://www.sizes.com
- www.cmfac.groups.et.byu.net: http://www.cmfac.groups.et.byu.net
- www.coloradoenergy.org: http://www.coloradoenergy.org
- www.courses.washington.edu: http://www.courses.washington.edu
- www.gpgypsum.com: http://www.gpgypsum.com
- www.inspectapedia.com: http://www.inspectapedia.com
- www.archtoolbox.com: http://www.archtoolbox.com
- [Image]: https://www.constructionspecifier.com/wp-content/uploads/2017/07/Figure-4-Dew-Point-Doc.jpg
- [Image]: https://www.constructionspecifier.com/wp-content/uploads/2017/07/Figure-6_edit.jpg
- [Image]: https://www.constructionspecifier.com/wp-content/uploads/2017/07/Figure-5-Dew-Point-doc.jpg
- [Image]: https://www.constructionspecifier.com/wp-content/uploads/2017/07/Figure-6-Dew-Point-doc.jpg
- here: http://www.constructionspecifier.com/confusion-over-dew-point-calculation-methods
- alliancerc@comcast.net: mailto:alliancerc@comcast.net
Source URL: https://www.constructionspecifier.com/illustrating-the-dew-point-an-effective-way-to-determine-its-value/
 [15]
[15]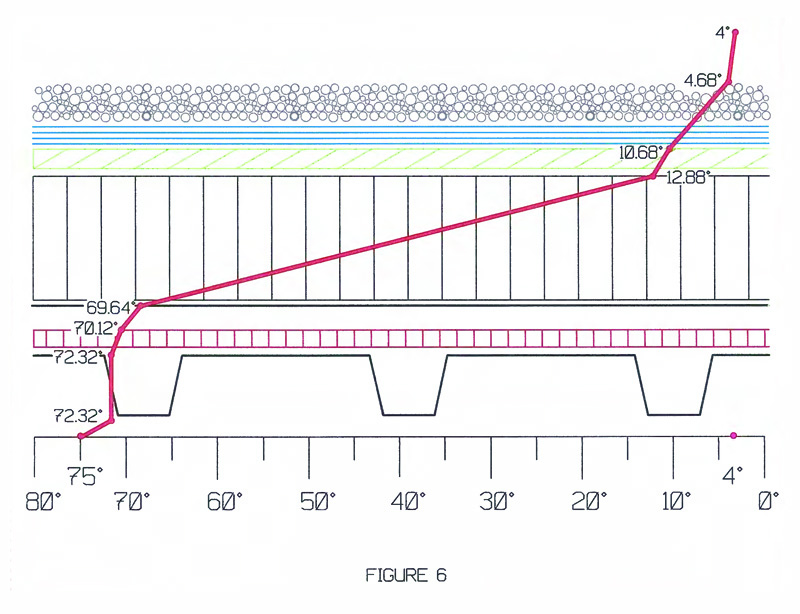 [16]
[16]