

by Brett T. Fagan, PE, and Adrian Gerard Saldanha
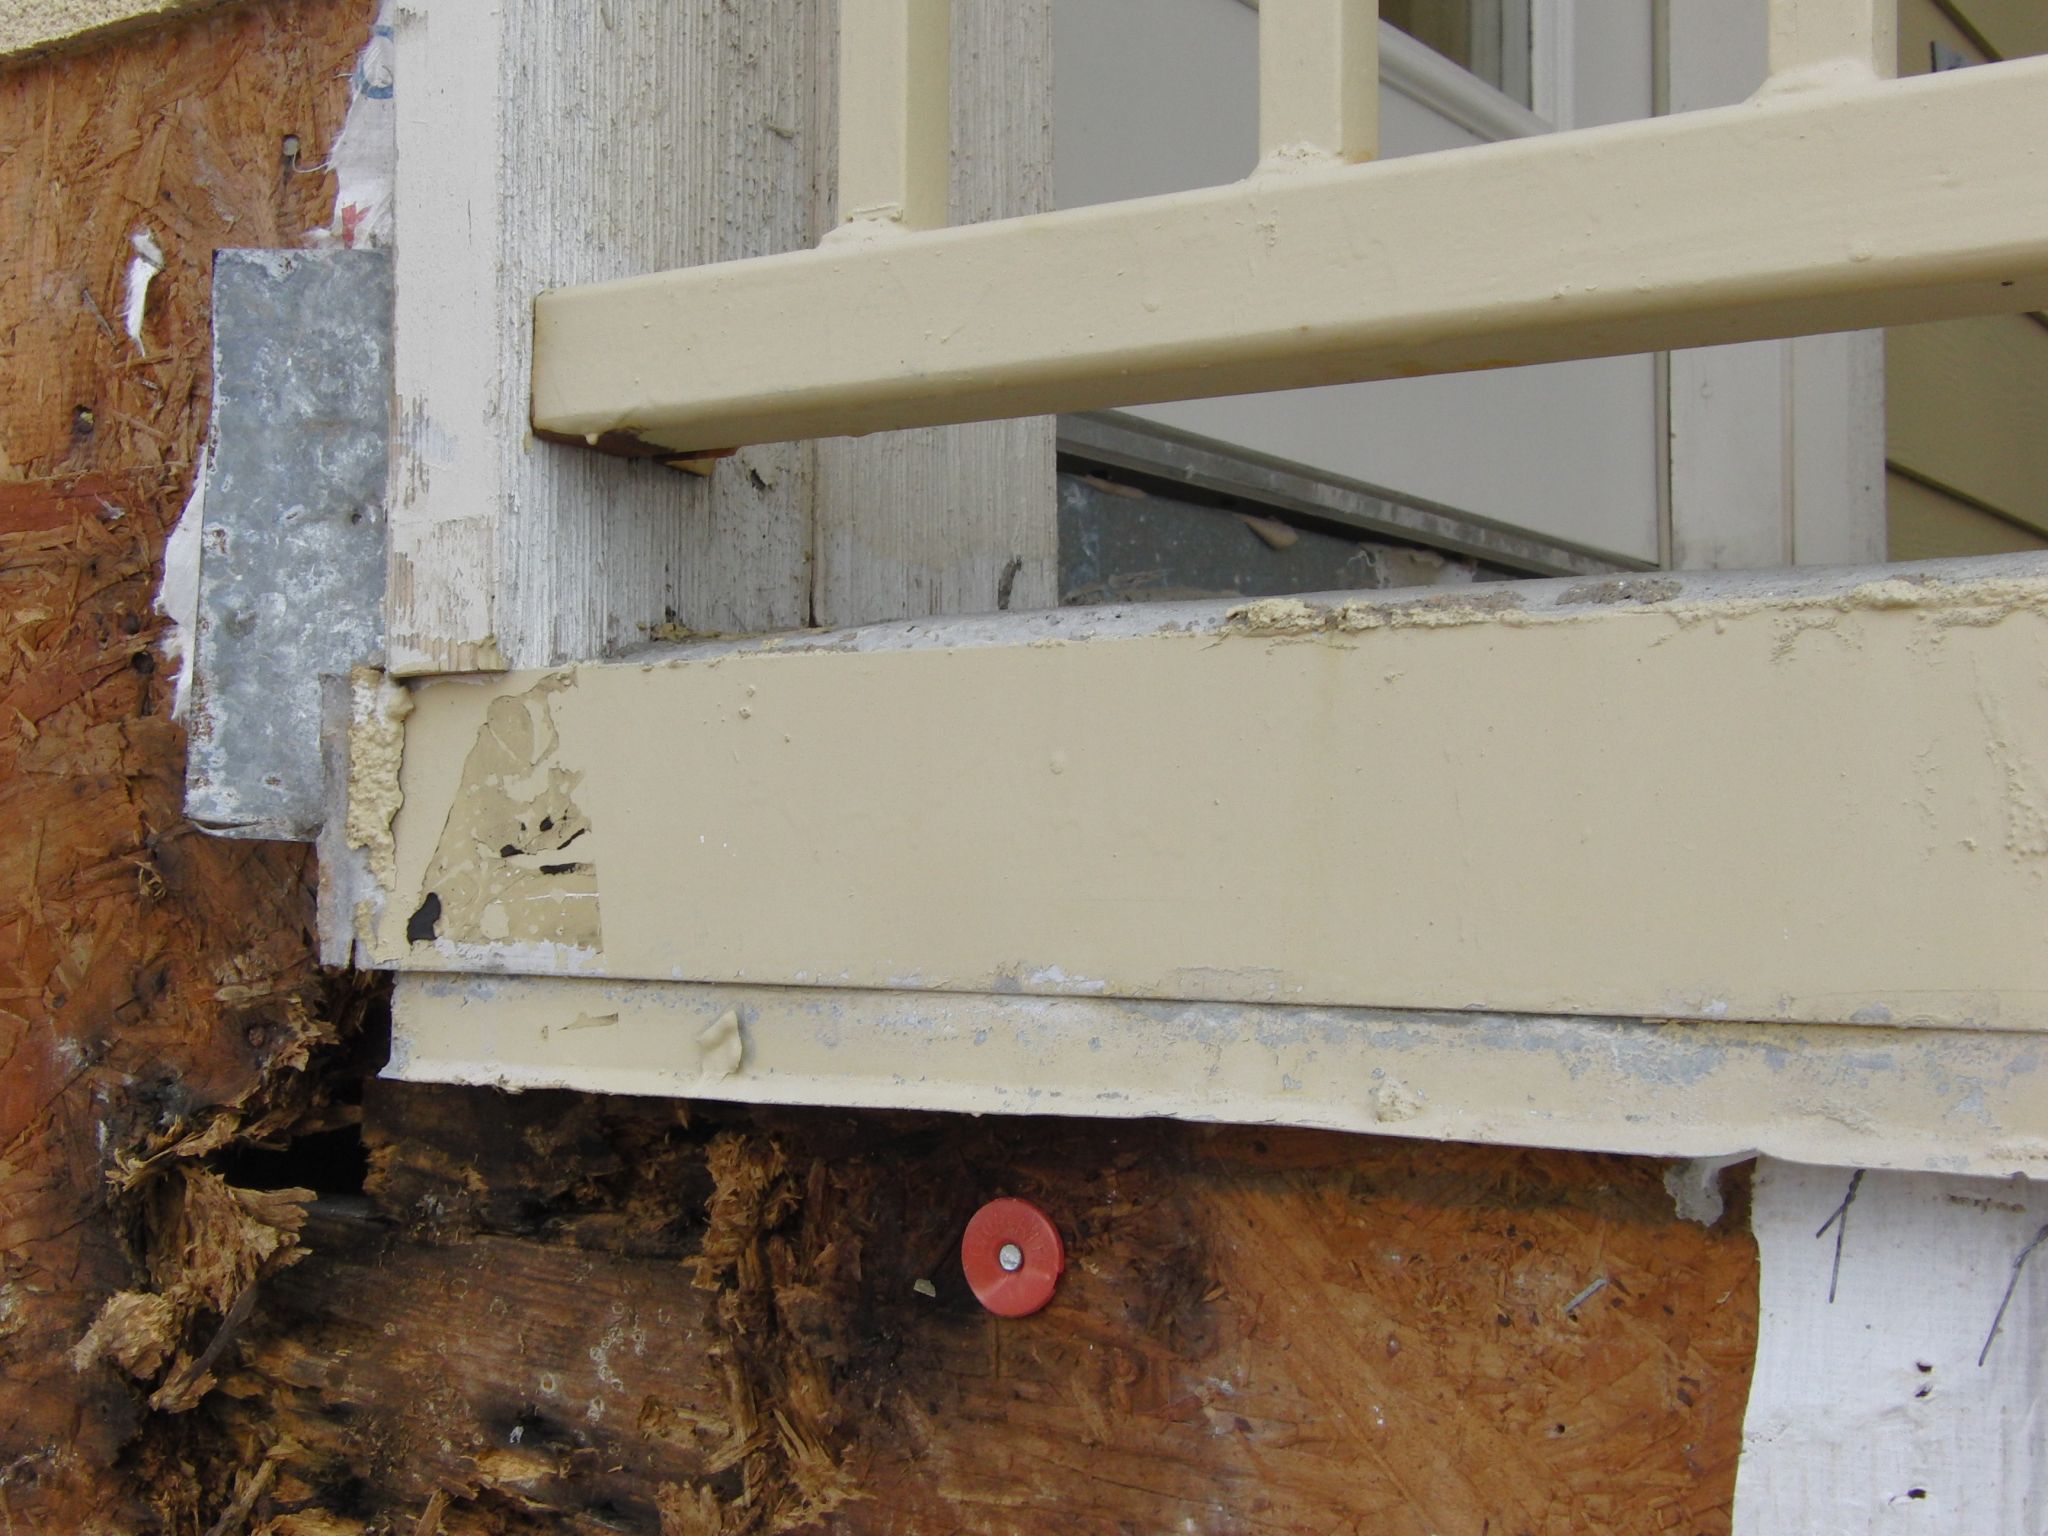
Sheathing decay caused by trapped water in building walls is a leading cause of construction damage. Unfortunately, because sheathing is concealed after construction, this only becomes evident after consequential distress develops in the structure or finishes.
Sheathing’s hidden location makes it difficult to evaluate its condition. Countless investigations have demonstrated it can be consumed by rot without detectable signs or symptoms, such as leaks to the building interior, odor, or cracks in interior and exterior finishes. Therefore, the ability to detect trapped moisture within the assembly is essential in evaluating an exterior wall’s durability. Although excavations are usually necessary, finding hidden water using non-destructive techniques such as infrared thermographic (IRT) surveys can be useful when the techniques are used correctly.1
It is possible to perform infrared surveys in hot climates (i.e. the South, traditionally, but an ever-growing portion of the country), but there are limitations. The authors have tested wall panels with wet sheathing in a laboratory environmental chamber to demonstrate the difference in infrared measurements between hot and cold weather. In both cases, water was applied to the sheathing; in the hot-weather simulation, however, the water was not readily detectable by the infrared survey and could have been missed.
IRT development
Infrared thermography is an investigative tool widely used to perform energy audits for buildings and other structures in the built environment. It uses the infrared spectrum of light to detect thermal anomalies, such as inefficient insulation or air leaks. During World War II, great strides were made in the field of infrared technology with the registration of several patents.2 Post-war declassification of IRT technology made it available for various applications in industrial and domestic markets.
The use of IRT technology for building diagnostics picked up pace when federal agencies recognized the impact of the huge cost of energy losses in the built environment. Rising fuel prices in the 1970s strained national energy budgets, leading to the roll-out of the Department of Energy’s (DOE) Weatherization Assistance Program (WAP) in 1976.3 This program provided support for low-income families to investigate the effectiveness of the building envelope’s insulating properties and resulting energy loss reduction.
More recent ‘green’ certification programs have provided further encouragement to building owners to improve energy performance of their properties. In general, a drive toward eco-friendly design, energy efficiency, and long-term cost savings has created a strong market for IRT professionals and equipment.
Although there is no single authority governing the training and procedures, ASTM International, the American Society for Nondestructive Testing (ASNT), and others have established standard practices. However, the authors did not find among their publications adequate warnings about the pitfalls of performing IRT surveys in hot climates.
Lab tests of wall panels
In a durability lab, the thermal performance was evaluated of wall panels representing different types of construction. They were subjected to conditions simulating a hot and a cold exterior, similar to the conditions to which a building envelope is subjected in different climates.
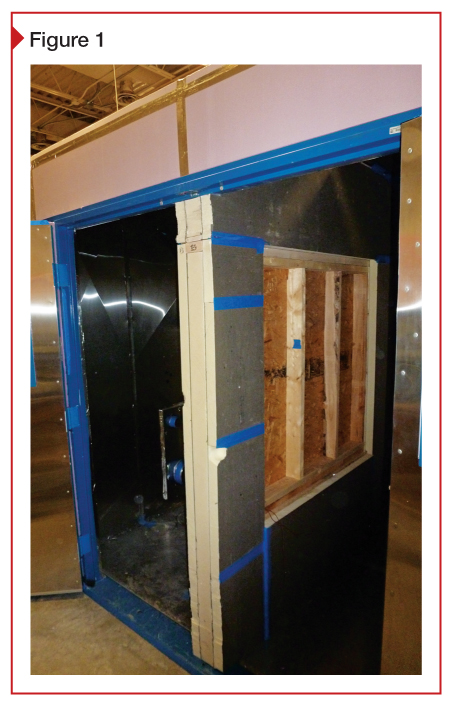
A demising wall was built in an insulated environmental chamber to serve as a partition between two spaces with different temperatures (Figure 1). This limits heat transfer between the two sides of the chamber, consisting of a wooden frame and 178 mm (7 in.) of polyisocyanurate (polyiso) insulation with an R-value of 42. Wall panels were installed in a 1.2-m (4-ft) square opening at the center of the demising wall. By separating the test chamber into two sections, it was possible to create heat flow through the wall panels.
Heating elements were placed on one side of the wall in an attempt to obtain a temperature difference of at least 10 C (18 F)—the minimum ‘delta’ recommended by ASTM C1060-11a, Standard Practice for Thermographic Inspection of Insulation Installation in Envelope Cavities of Frame Buildings. (Interestingly, some wall specimens could not maintain this temperature difference, even though they represent current construction practices, because they had insufficient insulation.) Connected to a data logger to measure the temperature at key locations over time, thermistors were installed at three locations on each side of the wall (six in total):
- at the center of the sheathing panel between studs;
- on the studs; and
- in the environmental chamber’s ambient air.
After three hours of heating, infrared images of the specimen were taken from both the hot and cold sides of the test wall. To simulate both cold and hot weather test conditions, the test panel was turned around within the demising wall opening on successive tests. The wall panels were tested dry on the initial round and with water applied to the bottom half of the sheathing on the second round to evaluate the challenges of detecting hidden moisture in wall panels.
Of course, water does affect heat flow. In a simple test, oriented strandboard (OSB) sheathing was left partially submerged in water overnight; there was a 5.6 C (10 F) difference in the OSB thermal image between the dry and wet regions of the board. However, this distinct difference can be masked—in the environmental chamber, infrared photographs taken from the hot side (i.e. exterior in a hot climate) made it hard to detect moisture on the sheathing.
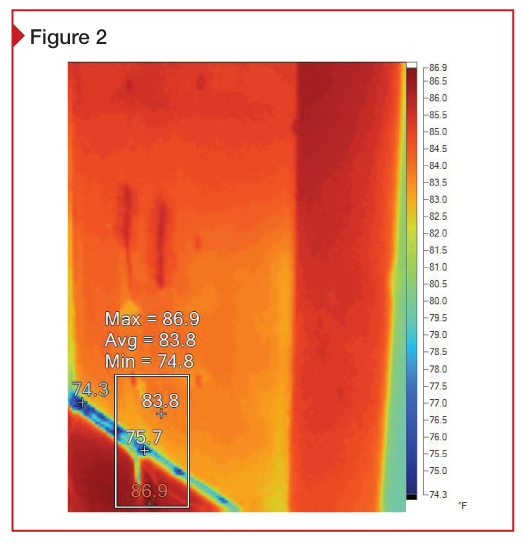
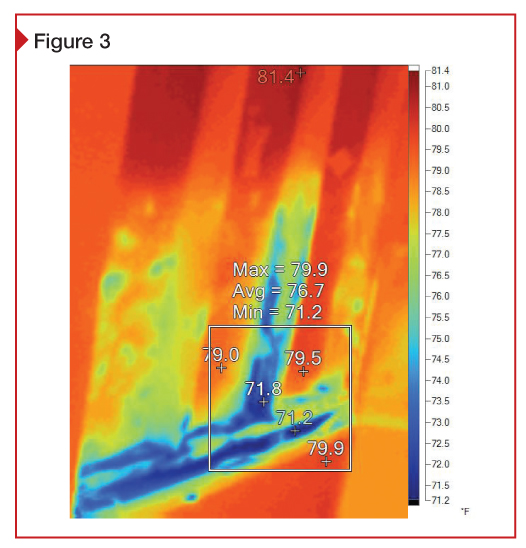
During the summer months in hot climates, heat flows from the exterior to the interior of a building. Thermal anomalies caused by wet sheathing become difficult to detect by daytime external IRT surveys due to solar loading of the building envelope. In typical IRT surveys, wet insulation is visible as a ‘patchy’ pattern.4 However, from the hot-side photograph, one was unable to observe any significant thermal anomaly (Figure 2). On the other hand, an interior photograph of the panel clearly displayed the effects of wetting the sheathing and framing (Figure 3). These conditions would be even more muted by exterior cladding and interior finishes; the lab tests were conducted with only framing, sheathing, and insulation.
Challenges to conducting effective IRT surveys
IRT surveys are affected by interior and exterior temperatures, sunlight, wind, and humidity. A few of the challenges facing IRT surveys are discussed in the following section.
Emissivity
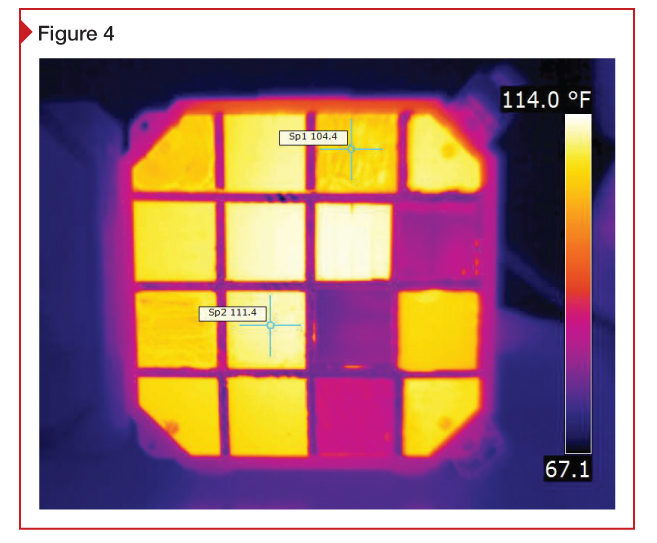
A material’s emissivity can affect the accuracy of the data obtained from IRT surveys.5 Varying from a scale of 0 to 1, emissivity is defined as the ability of a body to emit energy by radiation (basically, infrared waves) in comparison to a perfect emitter, which is known as a ‘blackbody.’ An infrared camera records a more accurate temperature for an object with an emissivity closer to 1 (Figure 4). Objects with low emissivity—such as metals—show up in the image as having lower temperatures than their actual temperature.
Reflected heat
Thermographers should also account for the difference in the reflective properties of the surface under observation. ASTM E1862–97, Standard Test Methods for Measuring and Compensating for Reflected Temperature using Infrared Imaging Radiometers, can be used to determine the reflective ambient temperature.6 Also, heat waves originating from other neighboring sources can be reflected from the surface under observation.
The reflected heat can be determined by measuring the temperature of a reflector such as a piece of aluminum foil. When measuring surfaces with low emissivity, reflected energy can influence the image captured by the camera. The thermographer should adjust the observation position to avoid anomalous images.7
Extreme atmospheric conditions
Extreme atmospheric conditions may cause the infrared camera to capture thermal noise from the air between the building and the thermographer. If hot or cold wind is present, the images may be highly variable. It is advisable to conduct the IRT survey with calm winds to avoid convective losses.8 Maintaining a constant distance from the building also yields more consistent results, as heat waves are diffused with distance.
Solar loading
Conducting an IRT survey of a wall assembly exposed to hours of sunlight can mask thermal anomalies behind the cladding, or can even give an opposite picture of actual conditions.9 The thermographer should either conduct the survey at night or on a cloudy day, or conduct an interior survey, taking into consideration the likely direction of heat flow.10
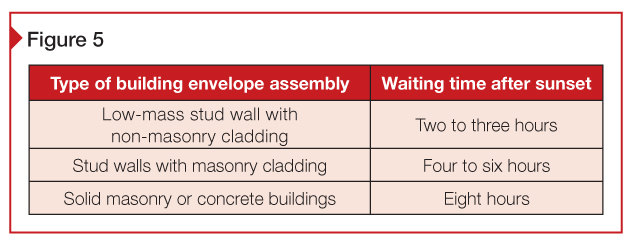
Canadian research recommends different waiting times post-sunset based on the type of building envelope assembly to start IRT surveys (Figure 5). These waiting times depend on the building assembly’s heat storage capacity, as this affects the rate at which solar heat is dissipated.11 These conditions would be magnified in a hot climate.
Marginal temperature deltas
Low temperature differences between the interior and exterior of a building make it hard to detect thermal anomalies. ASTM and Residential Energy Services Network (RESNET) recommend a temperature difference of at least 10 C (18 F) while inspecting building insulation. The detection of air leakage requires a smaller temperature delta of 5 C (9 F) per ASTM E1186-03, Standard Practice for Air Leakage Site Detection in Building Envelopes and Air Barrier Systems, and 1.7 C (3 F) per RESNET guidelines.12 With the advent of more advanced hardware, satisfactory results can be obtained with lower temperature deltas, and the RESNET standard has proven sufficient in the field.13
Successful IRT surveys
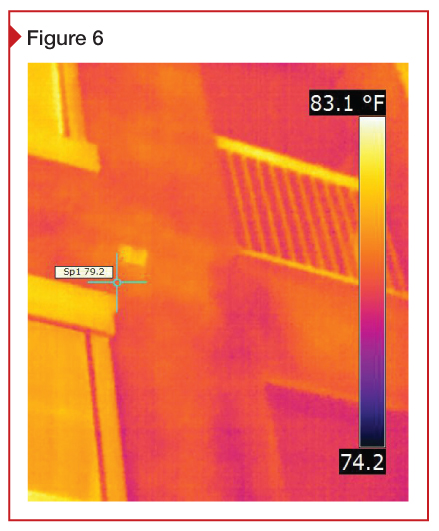
To conduct an accurate and reliable IRT survey, the thermographer should understand the building construction (Figure 6). Knowing the different components that could cause thermal anomalies aids in the detection of defects and deterioration.14
Weather conditions contributing to false positives or negatives should be avoided. Conducting surveys at night can help reduce the adverse effects of solar loading, but the temperature difference may be less than needed to identify thermal anomalies. Performing a survey of the north or east elevation late in the day may limit the masking of thermal anomalies. Daytime surveys during cloudy days also give acceptable results.15 Windy conditions should be avoided as these lead to convective losses. Similarly, one should not survey immediately after rainfall at the site.
Some variables cannot be controlled. For example, in studies of multi-family properties, the interior conditions have been found to be highly variable because residents set their air-conditioning equipment independently. The thermographer would need to have access to each unit interior to document the temperature difference.
Conclusion
Infrared cameras do not ‘see’ water—rather, they detect temperature. It requires a deductive conclusion by the thermographer whether a thermal anomaly is caused by the presence of water. Worse, in a hot climate, there may be no detectable thermal anomaly in an exterior IRT survey despite the presence of trapped water, leading to a false sense of security. Reports drawing conclusions from a single exterior IRT survey may yield incomplete and flawed results.
Still, IRT surveys in warm weather can be a useful part of a building evaluation. Recording the reflected apparent temperature, air temperature, wind speed, humidity, and other environmental conditions is important to evaluate the factors influencing the IR images. Ultimately, removal of exterior and/or interior finishes is required to confirm the findings of an IRT survey at suspected locations of water and sheathing deterioration.
Notes
1 The authors gratefully acknowledge the continuing support and leadership of David W. Fowler, PhD, PE—the faculty advisor for the research being performed at The Durability Lab, a testing center at the University of Texas at Austin (UT). The authors also thank Atila Novaselic, PhD, associate professor at the University of Texas’ Department of Civil, Architectural, and Environmental Engineering, for his facilities and assistance on this project, and Streetman Homes, who constructed the wall specimens. (back to top)
2 For more, see Xavier P.V. Maldague’s Theory and Practice of Infrared Technology for Nondestructive Testing (John Wiley & Sons, 2001). (back to top)
3 See Wayne Ruddock’s article, “Infrared Thermography: Making Wasted Energy Visible,” in the December/January 2012 issue of uptime: The Magazine for Maintenance Reliability Professionals. See also John Snell and Matt Schwoegler’s “The Use of Infrared Thermal Imaging for Home Weatherization” by visiting www.thesnellgroup.com/ReceiveWhitePapers.aspx. (back to top)
4 See C.A. Balaras and A.A. Argiriou’s article, “Infrared Thermography for Building Diagnostics,” in vol. 34 (2002) of Elsevier’s Energy and Buildings. (back to top)
5 See N.P. Avdelidis and A. Moropoulou’s “Emissivity considerations in building thermography” in vol. 35 (2003) of Energy and Buildings. (back to top)
6 See Paris Fokaides and Soteris Kalogirou’s article, “Application of Infrared Thermography for the Determination of the Overall Heat Transfer Coefficient (U-value) in Building Envelopes,” in vol. 88 (2011) of Elsevier’s Applied Energy. (back to top)
7 For more information on the RESNET Interim Guidelines for Thermographic Inspections of Buildings, visit www.resnet.us. (back to top)
8 See notes 4 and 6. (back to top)
9 See Schwoegler’s 2011 report, “Successful Warm-weather Infrared Inspections,” published by the Snell Group. (back to top)
10 See note 4. (back to top)
11 The difference between large buildings and residential infrared thermographic inspections is like night and day. See Antonio Colantonio and Greg McIntosh’s presentation at the 11th Canadian Conference on Building Science and Technology, held in Banff, Alberta in 2007. (back to top)
12 See note 7. (back to top)
13 See note 9. (back to top)
14 This comes from Greg Stockton’s “Applications for Infrared Thermography as an NDT Method for Buildings,” presented in Buenos Aires, Argentina, at the 2007 IV Conferencia Panamericana de END. (back to top)
15 See note 5. (back to top)
Brett T. Fagan, PE, is a principal with Building Diagnostics Inc., specializing in the investigation of problems with existing buildings, designing remedies for those problems, and resolving disputes that arise from them. Fagan is also a Level 1 Certified Infrared Thermographer, and participates in the company’s research group at the University of Texas at Austin (UT)—The Durability Lab. He can be reached by e-mail at bfagan@buildingdx.com.
Adrian Gerard Saldanha is completing his master’s degree in construction engineering and project management at UT. He is a graduate research assistant in The Durability Lab. Saldanha can be contacted at asaldanha@buildingdx.com.
To read the sidebar, “Investigating Sheathing Durability: Professional Organizations, Standard Practices, and Operator Training,” click here.
To read the sidebar, “Investigating Sheathing Durability: Recommended IR Camera Specifications,” click here.

