

Assessment findings
Each of the facilities chosen for analysis had at least a few items requiring insulation. The smallest number of individual items identified in a building was 14. It included:
- one 12-ft (3.6-m) long, 2-in. (51-mm) copper tube;
- one 3-ft (0.9-m) long, 3/4-in. (19-mm) copper tube;
- six 2-in. 90-degree elbows;
- five 2-in. ball valves; and
- one 3/4-in. ball valve.
The largest concentration of items was in a boiler plant facility that provides central steam and domestic hot water to four buildings in the Capitol Complex. Approximately 400 individual items were identified in this facility (including tunnels), and savings due to insulation provided an estimated payback of four years.
Overall, approximately 3500 items were identified. Estimated total savings were approximately 6 billion Btus per year, with an estimated payback of four years and an annualized rate of return of 24 percent. These projected savings are primarily in natural gas use and represent roughly eight percent of the total analyzed facility’s natural gas consumption.
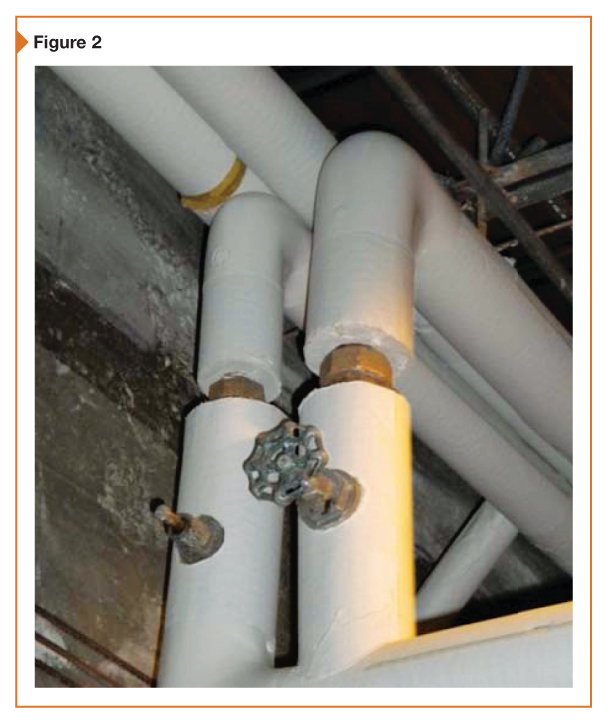
As expected, some items identified were large, such as the uninsulated flanged end cap on a large, low-pressure steam header shown in Figure 1. The majority, however, were relatively minor like the uninsulated unions and valve bonnets on the hot-water heating lines shown in Figure 2. While the savings from any single item is small, the total savings from thousands of small items is significant.
Figure 3 summarizes the overall results of the appraisal, sorted in order of decreasing energy savings. Building energy usage information was derived from data provided by the State of Montana and, in most cases, is the average consumption over a four-year period (i.e. 2007 to 2010).2
Energy Use Intensity (EUI)—measured in units of kBtu/sf/yr—is the annual building site energy consumption (electrical and natural gas) per square foot of gross building area. Available EUIs for the Helena buildings range from a high of 193 to a low of 47.3 The unweighted average EUI for these buildings is roughly 92 kBtu/sf/yr. For reference, the U.S. Energy Information Agency’s (EIA’s) 2003 Commercial Building Energy Consumption Survey for this climate zone lists average EUI values for offices at 92 and assembly buildings at 102.
Numerous key assumptions were required to develop the energy savings estimates, including the operating hours of the mechanical systems involved. Heating systems are assumed to operate for eight months during the winter, or 5840 hours per year. Additional assumptions include an operating temperature of 80 F (27 C) and ambient conditions inside the mechanical rooms with 1-mph (1.6-km/h) wind speed.
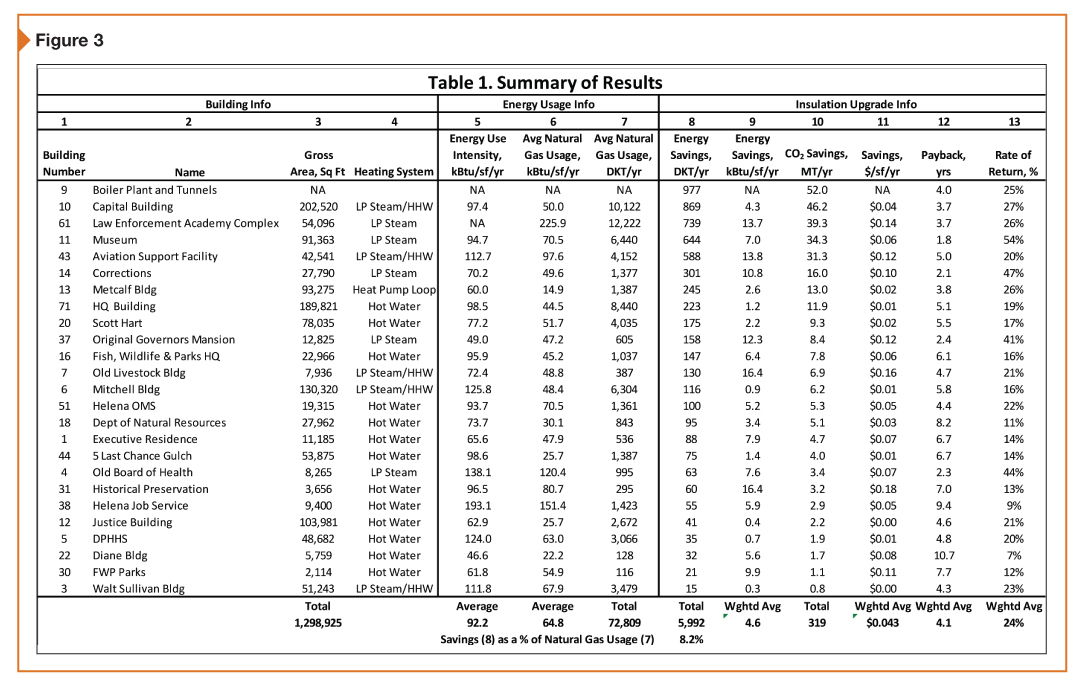
The total estimated savings are approximately 6 billion Btu/yr. The weighted average savings are 4.6 kBtu/sf/yr. This represents 8.2 percent of natural gas usage in the facilities studied. In most cases, the insulation opportunities identified will reduce natural gas consumption. However, a few of the buildings have electrically heated domestic hot-water systems—in those buildings, a small portion of the energy savings due to mechanical insulation shows up as electrical energy savings. These electrical energy savings are expressed as dekatherms and included in the estimates.
The savings estimates in Figure 3 are converted to the associated reductions in CO2 emissions (annual metric tonnes) and then to financial savings ($/sf/yr).
Insulation cost estimates were prepared on a facility-by-facility basis using the summaries developed during site visits. The estimates assume various insulation systems depending on the application. The primary insulation system used in the estimates was fiberglass pipe insulation with all service jacket and removable/replaceable flexible insulation covers.
Column 12 in Figure 3 shows the estimated payback period of the insulation project in years, while column 13 gives the annualized rate of return (assuming a 20-year life and no fuel cost escalation4). The estimated payback periods range from 1.8 years to 10.7 years. Corresponding annualized returns range from seven to 54 percent.
As might be expected, the steam-heated facilities generally showed shorter payback periods. Steam supply piping operates at roughly 230 F (110 C) during the heating season, while hot-water supply temperatures are normally reset in a range from 120 to 180 F (49 to 82 C) based on outdoor conditions. Insulating steam systems will therefore not only exhibit greater energy savings, but also quicker payback.
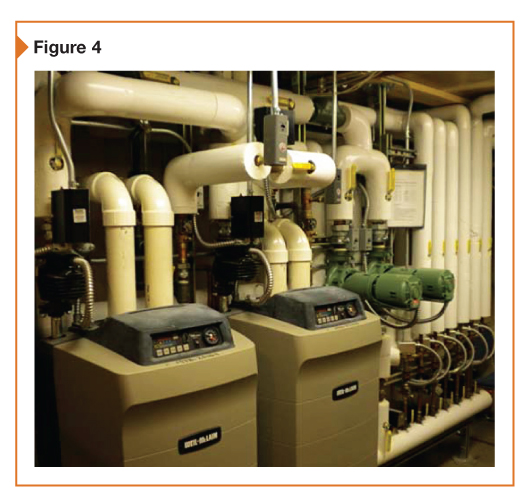
The variation in financial returns is not unexpected. All the buildings inspected had mechanical insulation on their steam and hot water lines, although some systems were in better shape than others. Several had been recently upgraded to high-efficiency condensing boilers with well-insulated piping (Figure 4). While numerous small items were identified in each of these facilities, the ‘low-hanging fruit’ had been gathered.


Hi, I work with Indiana Legislative Services and would like to know the average cost of installing mechanical insulation. I understand this is difficult to estimate, but if you could provide some sort of range I’d appreciate it.