Simplifying Thermal Analysis: Easier methods can demonstrate product and code needs

Observation 2
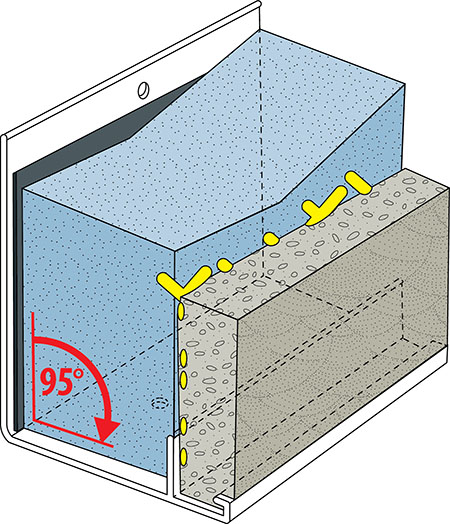
Transition details can have a major impact on overall thermal performance. Design professionals should ask material suppliers for recommended transition details that are weathertight and thermally efficient. When in doubt, one should model the transition using THERM 7.3. Poor transition details from window to opaque area can decrease the area of the better insulated opaque area.
Typically reported U-values for materials do not consider the transition details since test methods like ASTM C1363 and NFRC 100 do not require it. Therefore, it is important to review with the material suppliers the recommended modeled or tested transition details.
Case 3: High-performance systems
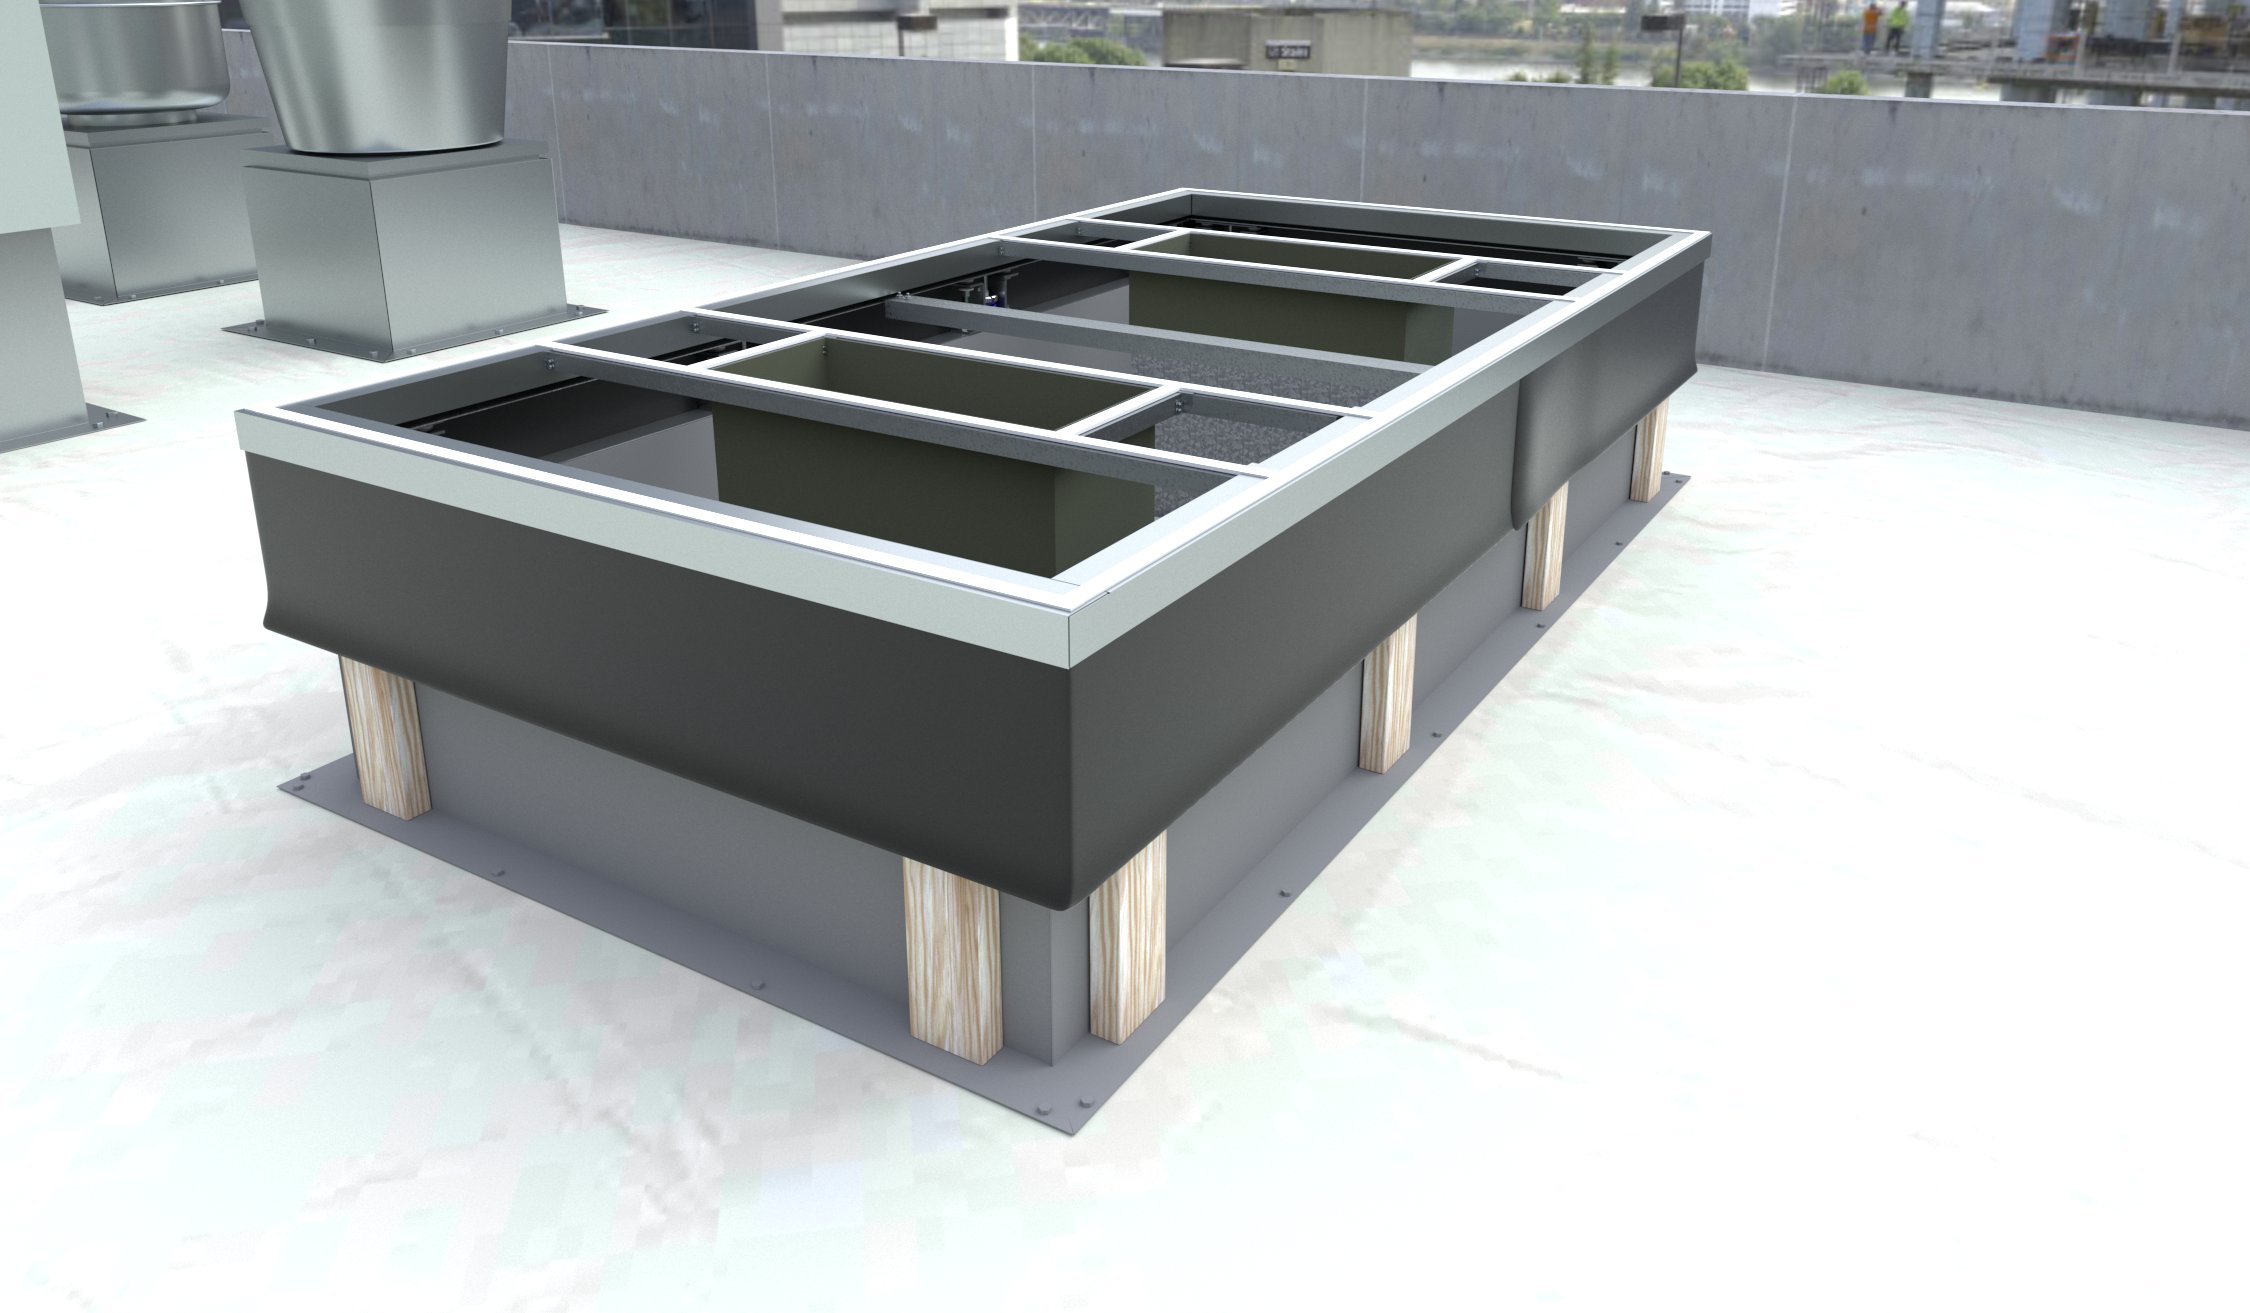
There are windows that have tested high performance and have designed transitions to make it thermally efficient with very little negative impact from the transition details. These systems are available with insulated metal panels and integrated windows designed to interface with the panel perimeter.
To demonstrate this with a case study, this article will assume there is a window with a tested U-value of 1.59 (0.28) seamlessly transitioning to an opaque wall area with a tested U-value of 0.284 (0.05)—in other words, from an R-3.6 to an R-20. For the wall with 30 percent windows and 70 percent opaque area, the U0 value is 0.79 (0.12)—an R-8.4—which is 33 percent better than the code expectations and 215 percent better than the system with the minimum standards with a poor transition.
Observation 3
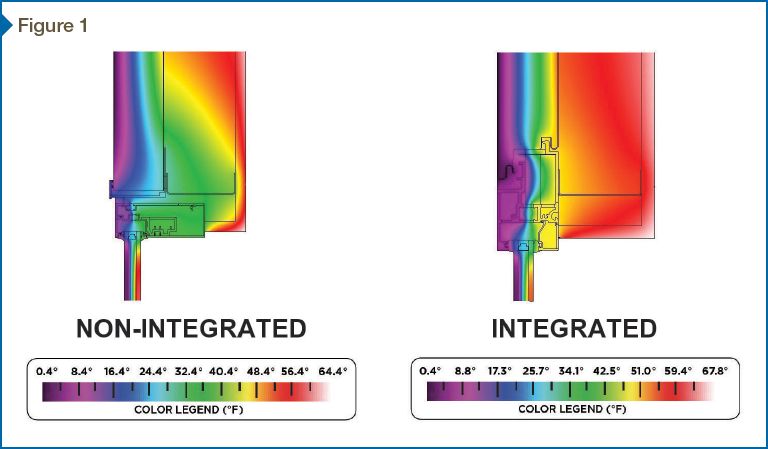
Using these simple tools, the benefits of using an incrementally better window and wall systems can be demonstrated. Figure 1 shows an insulated metal panel (IMP) with a window; it illustrates non-integrated versus integrated details. The image on the left is a thermograph of a transition using trim without thermal breaks and a non-integrated window system. The figure on the right is a thermograph of a window system designed to integrate with an adjacent IMP with properly aligned thermal breaks.
Case 4: Thermal improvements to existing structures
These methods can also be used to approximate wall performance and decide which wall modifications have the greatest impact. For this case study, a completed project in a cold climate had a wall design initially designed near the minimum code requirements. The windows had a tested U-value of 2.84 (0.5), and the opaque area was 0.403 (0.071)—an R-2 and an R-14, respectively. The windows were 40 percent of the exterior, and the opaque area was the other 60 percent. The transition details were good—as required by code in all walls, a continuous air barrier is needed throughout the building envelope. The U0 equation yields a whole wall U-value of 1.36 (0.24)—an R-4.17.
Through several extremely cold winters, it was decided to improve the wall thermal performance. The easiest solution was to add insulation behind the opaque wall area to enhance the U-value of the opaque area to (0.05)—R-20. (To achieve the additional R-6 insulation, extra insulation had to be added in order to overcome the thermal shorts of the metal studs.3)
In this first design change, the windows remained unchanged. Using the U0 equation, the whole wall U-value was improved to 1.31 (0.23)—the R-4.35 was only a 4.3 percent improvement by increasing the opaque insulation by nearly 50 percent.
Should the improvements have focused on the window system—improving from a U-value of 0.5 to a U-value of 1.59 (0.28) or R-3.5 the overall wall U-value—then U0 would have been 0.880 (0.155) or R-6.5, which would have been a 56 percent improvement to the overall insulation value.
Observation 4
Increasing the window’s thermal performance will have a much greater impact on the overall wall performance than increasing the insulation value of the opaque area. Therefore, it is important to use the best window the project budget allows.
Conclusion
Using the U0 equation, along with the simple thermal modeling tool of THERM 7, can offer meaningful information for the design of the thermal envelope. Of particular note is the use of windows with excellent thermal performance along with transition details. Other areas of note, but not presented in this article, are the wall-to-roof and wall-to-slab details.
Keith Boyer, PE, is the director of architectural wall technology for Centria. He is involved with long-term product development for architectural wall products, support of major projects in the proper application of products, and training. Extensively involved in the industry, Boyer has served on several ASTM committees for standing seam metal roofs, and has recently been involved with an American Architectural Manufacturers Association (AAMA) task force to develop testing protocols for rainscreen wall systems. He has also been active with the Metal Construction Association (MCA) foam panel council. Boyer can be reached at kboyer@centria.com.
Sign up for our weekly newsletter
Architectural materials and methods delivered right to your inbox
- CSI News and Notes: CSI Foundation’s construction camp; CSI spring exam; and more
- CSI News and Notes: CSI’s credentials; CSI conference theme; and more
- To be specific – CSI supports young AECO professionals
- CSI News and Notes: CSI’s foundation scholarships, national conference, and Crosswalk
- CSI News and Notes: AI’s impact; CSI 2024 conference, and more
Products
Read the Latest Issue