Simplifying Thermal Analysis: Easier methods can demonstrate product and code needs
by Katie Daniel | January 5, 2016 2:58 pm
 [1]
[1]by Keith Boyer, PE
In the age of high-thermal-performance building envelopes, there can be many surprises when the designed wall system does not meet the expected performance criteria. Sometimes these ‘misses’ are significant and can severely impact the energy use for a building. Transitions from one material type to another, such as opaque wall areas to windows and wall to roof, are often the cause.
The thermal performance of an entire wall assembly can be determined by knowing and understanding basic heat flow properties, such as U-values for materials and job-specific details. While there are very powerful 3-D finite element programs available to evaluate specific assemblies, these are complex, costly, and not used as often as they should be. There are simpler methods using the American Society of Heating, Refrigerating, and Air-conditioning Engineers’ (ASHRAE’s) U equation (found in its Fundamentals handbook), along with the THERM 7.3 program developed by Lawrence Berkeley National Laboratory (LBNL).
ASHRAE fundamentals provide a simple equation to determine the effective or average U-value of a wall system based on parallel heat flow paths and a weighted average based on area. U-values for various elements of a wall—like opaque areas and windows—are typically readily available from standard testing. For example, there is ASTM C1363, Standard Test Method for Thermal Performance of Building Materials and Envelope Assemblies by Means of a Hot-box Apparatus, for opaque areas. National Fenestration Rating Council (NFRC) 100, Procedure for Determining Fenestration Product U-factors, and American Architectural Manufacturers Association (AAMA) 1503, Voluntary Test Method for Thermal Transmittance and Condensation Resistance of Windows, Doors and Glazed Wall Sections, are available for window assemblies.
For the elements that do not have tested U-values, THERM 7.3 can be used to approximate a U-value. A good approximation for overall wall performance can be obtained through the use of the U equation and tested or modeled U-values. For this article’s purposes, the test assembly will be a wall that has only opaque and window areas. With this simplified assembly, the U equation has only two terms as shown below:
U= ((UOAAreaOA) + UwindowAreawindow))/Area
In this equation, AreaOA is the opaque wall area, whereas Area is the total wall area—the sum of AreaOA and Areawindow.
Case 1: Code requirements/whole-wall U-value
The International Energy Conservation Code (IECC) establishes the minimum thermal performance levels (i.e. maximum U-value) for the opaque areas and the windows. For Zone 5 of the 2012 IECC, the maximum U-value for opaque wall areas on metal-framed (studs) buildings is 0.363 w/(m2 K), (0.064 Btu/(hr sf F)), which converted to terms of thermal resistance is an R-15.6.
For the same zone, the fenestration maximum U-value is 2.158 (0.38), which is an R-2.6. Also established is the prescriptive maximum fenestration area, which is 30 percent. Given this input and the U equation, the IECC minimum code standard for a wall with opaque areas and windows is U= 0.90 (0.159) or R-6.3.2
Observation 1
Windows can severely degrade the whole wall thermal performance. The code assumes a seamless transition between window and opaque area.
 [2]
[2]Case 2: Window perimeter transition details
Frequently, the connection between a window and the surrounding opaque area focuses on weather-tightness and not thermal efficiency. Weather-tightness is needed and should not be compromised, but often better thermal details are desired. Details degrading the thermal performance include:
- metal panning or flashing that violates the window frame thermal breaks;
- the plane of the insulated glass unit (IGU) does not align with the insulation in the opaque area; and
- thermal breaks that are not properly aligned.
Through modeling these transitions using THERM 7.3, it was determined that, depending on the detail, the affected transition area can be approximately 305 mm (12 in.) wide around the window perimeter and can have a heat flow through this area much increased from the opaque material U-value to values approximately equal to the window.
To simplify this evaluation, and to demonstrate use of this evaluation process, it is assumed the affected area is 305 mm wide and the heat flow is equal to that of the window. This, in essence, is increasing the area of the window. For a 1.5-m (5-ft) square punched window with a 305-mm transition, the window area is essentially doubled and the opaque area is decreased by the same amount. Using this info in the U equation for the code minimum example above, the U value increases to 1.44 (0.254), or R-3.9 in IP units. This is 38 percent less than the expected code minimum of R-6.3.
The code is clear about minimum performance levels for both opaque areas and fenestration, but does not prescribe the transition details. Similarly, none of the standard test protocols establish material U-values. Unless designers are good stewards concerning the transitions, there can be a whole wall installation that, although it meets the letter of the code, fails to meet the spirit of the code. This can be achieved by avoiding thermal shorts via through-metal flashing and trim, aligning breaks in the adjacent materials, and, when possible, creating a thermal model using Therm 7.3.
ASHRAE-sponsored research to investigate the effects of transition details as was published in ASHRAE Research Project (RP) 1365, Thermal Performance of Building Envelope Details for Mid- and High-rise Buildings. However, some of the better transitions were not modeled.
 [3]
[3]Observation 2
Transition details can have a major impact on overall thermal performance. Design professionals should ask material suppliers for recommended transition details that are weathertight and thermally efficient. When in doubt, one should model the transition using THERM 7.3. Poor transition details from window to opaque area can decrease the area of the better insulated opaque area.
Typically reported U-values for materials do not consider the transition details since test methods like ASTM C1363 and NFRC 100 do not require it. Therefore, it is important to review with the material suppliers the recommended modeled or tested transition details.
Case 3: High-performance systems
There are windows that have tested high performance and have designed transitions to make it thermally efficient with very little negative impact from the transition details. These systems are available with insulated metal panels and integrated windows designed to interface with the panel perimeter.
To demonstrate this with a case study, this article will assume there is a window with a tested U-value of 1.59 (0.28) seamlessly transitioning to an opaque wall area with a tested U-value of 0.284 (0.05)—in other words, from an R-3.6 to an R-20. For the wall with 30 percent windows and 70 percent opaque area, the U value is 0.79 (0.12)—an R-8.4—which is 33 percent better than the code expectations and 215 percent better than the system with the minimum standards with a poor transition.
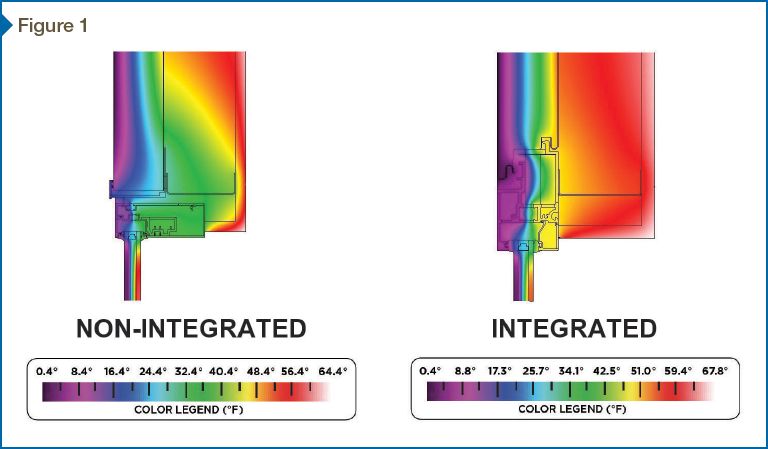
Observation 3
Using these simple tools, the benefits of using an incrementally better window and wall systems can be demonstrated. Figure 1 shows an insulated metal panel (IMP) with a window; it illustrates non-integrated versus integrated details. The image on the left is a thermograph of a transition using trim without thermal breaks and a non-integrated window system. The figure on the right is a thermograph of a window system designed to integrate with an adjacent IMP with properly aligned thermal breaks.
 [4]
[4]Case 4: Thermal improvements to existing structures
These methods can also be used to approximate wall performance and decide which wall modifications have the greatest impact. For this case study, a completed project in a cold climate had a wall design initially designed near the minimum code requirements. The windows had a tested U-value of 2.84 (0.5), and the opaque area was 0.403 (0.071)—an R-2 and an R-14, respectively. The windows were 40 percent of the exterior, and the opaque area was the other 60 percent. The transition details were good—as required by code in all walls, a continuous air barrier is needed throughout the building envelope. The U equation yields a whole wall U-value of 1.36 (0.24)—an R-4.17.
Through several extremely cold winters, it was decided to improve the wall thermal performance. The easiest solution was to add insulation behind the opaque wall area to enhance the U-value of the opaque area to (0.05)—R-20. (To achieve the additional R-6 insulation, extra insulation had to be added in order to overcome the thermal shorts of the metal studs.3)
In this first design change, the windows remained unchanged. Using the U equation, the whole wall U-value was improved to 1.31 (0.23)—the R-4.35 was only a 4.3 percent improvement by increasing the opaque insulation by nearly 50 percent.
Should the improvements have focused on the window system—improving from a U-value of 0.5 to a U-value of 1.59 (0.28) or R-3.5 the overall wall U-value—then U would have been 0.880 (0.155) or R-6.5, which would have been a 56 percent improvement to the overall insulation value.
Observation 4
Increasing the window’s thermal performance will have a much greater impact on the overall wall performance than increasing the insulation value of the opaque area. Therefore, it is important to use the best window the project budget allows.
Conclusion
Using the U equation, along with the simple thermal modeling tool of THERM 7, can offer meaningful information for the design of the thermal envelope. Of particular note is the use of windows with excellent thermal performance along with transition details. Other areas of note, but not presented in this article, are the wall-to-roof and wall-to-slab details.
Keith Boyer, PE, is the director of architectural wall technology for Centria. He is involved with long-term product development for architectural wall products, support of major projects in the proper application of products, and training. Extensively involved in the industry, Boyer has served on several ASTM committees for standing seam metal roofs, and has recently been involved with an American Architectural Manufacturers Association (AAMA) task force to develop testing protocols for rainscreen wall systems. He has also been active with the Metal Construction Association (MCA) foam panel council. Boyer can be reached at kboyer@centria.com[5].
- [Image]: http://www.constructionspecifier.com/wp-content/uploads/2016/01/insulation_Great-Lakes-Research-Center-_-Houghton-MI.jpg
- [Image]: http://www.constructionspecifier.com/wp-content/uploads/2016/01/insulation_New-Orleans-East-Hospital-_-New-Orleans-LA.jpg
- [Image]: http://www.constructionspecifier.com/wp-content/uploads/2016/01/insulation_Mary-Bird-Perkins-Cancer-Center-_-Houma-LA.jpg
- [Image]: http://www.constructionspecifier.com/wp-content/uploads/2016/01/insulation_Figure-1.-Thermo-images.jpg
- kboyer@centria.com: mailto:kboyer@centria.com
Source URL: https://www.constructionspecifier.com/simplifying-thermal-analysis-easier-methods-can-demonstrate-product-and-code-needs/