A thermal insulation example
Due to the structure provided by underlying ISO standards and a relevant PCR, most EPDs follow a similar format. The basic requirements for a typical EPD for a building material can generally be met in a relatively short document—perhaps three or four pages. However, because current standards provide a number of options in regard to supplemental information that may be provided in an EPD, some product declarations can be much longer and contain a wide variety of graphics and pictures.
As mentioned, EPDs may be either generic or proprietary in scope. In the former, data is disclosed relating to a common product produced by multiple manufacturers, and the impacts are based on a weighted average of their combined production. Proprietary EPDs, on the other hand, disclose data relating to a single product produced by a single manufacturer, and the impacts disclosed are based on that manufacturer’s total production.
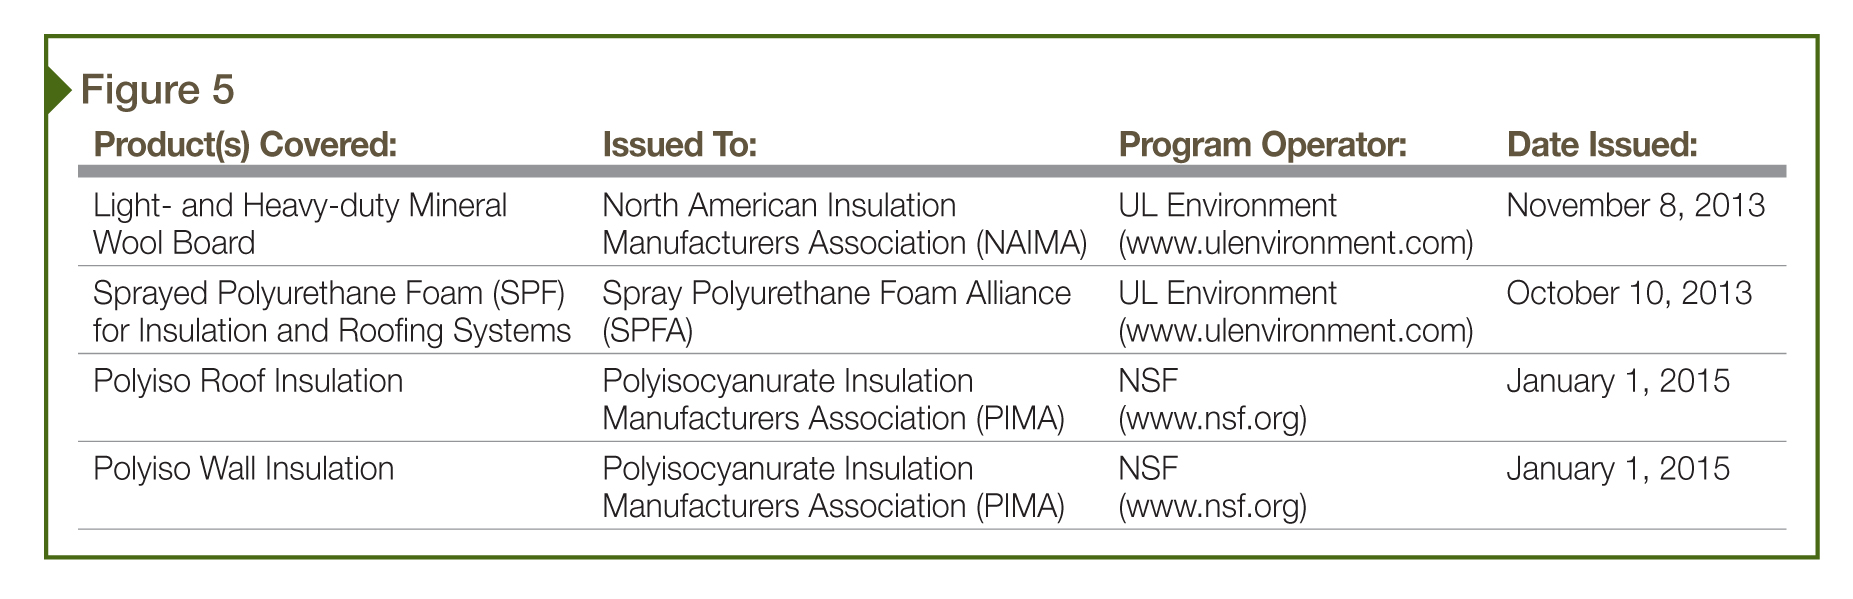
Due to the expense that is associated with the development of EPDs, many in the initial wave were generic rather than proprietary. By joining together to develop a common EPD for functionally similar products, individual manufacturers can pool their resources and achieve economies of scale. (Additionally, end users are provided with a useful ‘baseline’ for functionally similar products that may be useful in developing nonproprietary specifications.) For example, within the last two years, four detailed generic EPDs have been published for building thermal insulation products. Figure 5 identifies the products covered by these EPDs, as well as the initiating organization, program operator publisher, and date of issue.
Copies of these EPDs are maintained by the program operator and are available for free download from the websites referenced in Figure 5. Beyond the generic EPDs listed in this table, some individual manufacturers have published proprietary EPDs for various thermal insulation products, including glass fiber batt and XPS boards. In all cases, these EPDs are based on the same PCR, and all have been certified as ISO 14025-compliant.
In addition to following the same PCR, the overall format of these EPDs is similar. Each EPD starts with a certification page verifying it was developed in accordance with ISO 14025, including third-party verification by the program operator. Additionally, the certification page identifies the PCR used to develop the EPD and the organization that performed the basis LCA.
Inside each EPD is a lifecycle diagram showing all the processes, inputs, and outputs included within the required system boundary. Further, the EPD contains additional charts and figures to help explain the makeup and function of the product, including illustrations, manufacturing process flows, and typical construction details. EPDs also may include a broad range of additional information that may be helpful to the end user. These include:
- references to relevant product technical standards;
- key performance information (e.g. fire resistance and moisture resistance);
- other environmental benefits (e.g. energy payback and recycled content); and
- information regarding product use toward achieving LEED credits.
Each thermal insulation EPD also specifically identifies the functional unit used to measure all environmental impacts. As discussed, the functional unit for thermal insulation is a square meter of insulation with a metric RSI value of 1. Frequently, the EPD provides additional information to help the end-user better understand the functional unit. As an example, a thermal insulation EPD may discuss exactly how R-value is measured for the product as well as how to convert RSI values into the ‘inch-pound’ R-values.
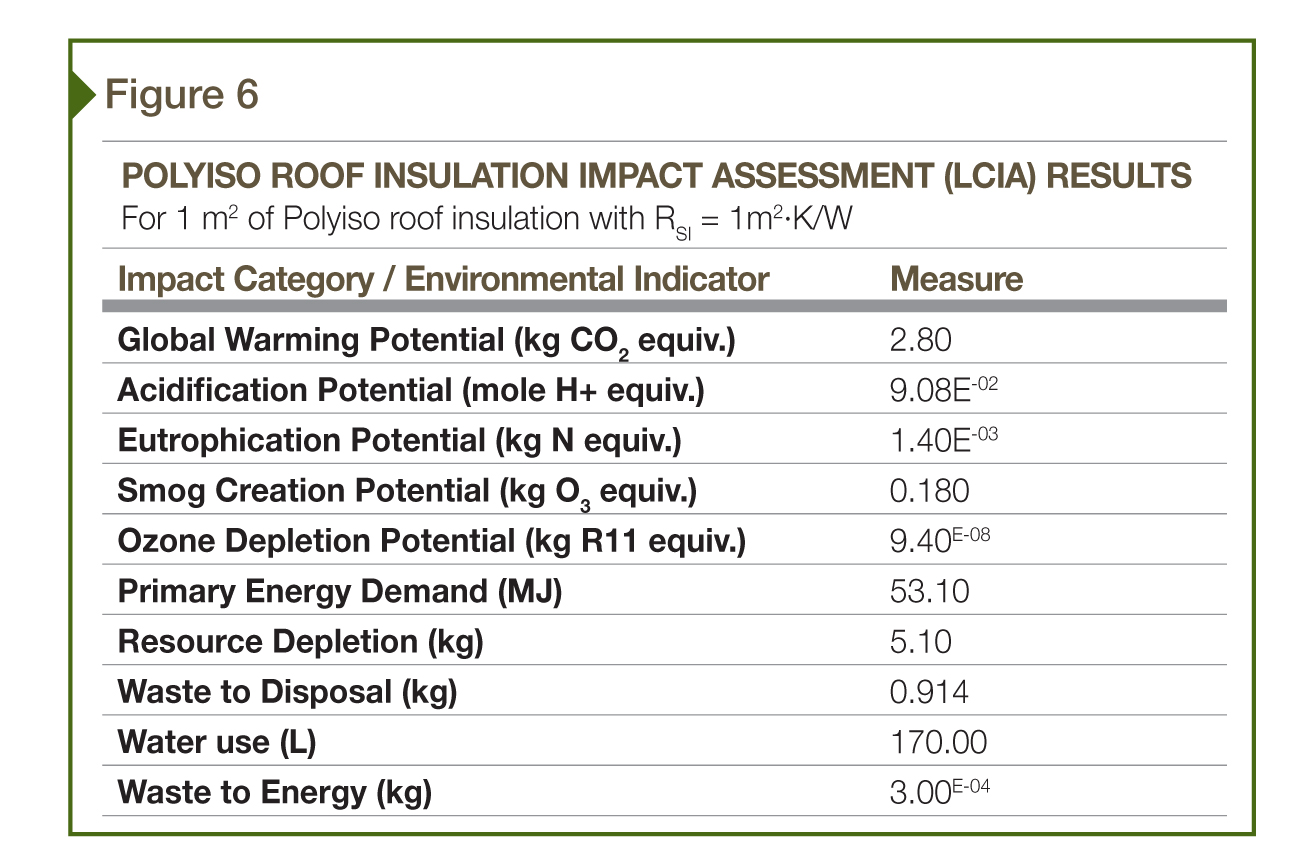
Finally, each EPD contains a summary table of impacts—undoubtedly, the most important part of the disclosure document. Figure 6 provides an example of a summary impact table taken from the EPD for generic polyiso roof insulation previously referenced in Figure 5.
A number of important elements may be identified in this typical impact table. First, the table identifies the specific impact categories/environmental indicators for which impacts are reported. As an example, the first impact category shown in the table is global warming potential (GWP). Next, the table identifies the impact units for each impact category. In this case, the impact unit for GWP is kilograms of CO2, or carbon dioxide equivalents. Additionally, the table identifies the specific impact measure, which is 2.32 kg of CO2 equivalents. Finally, the table identifies the functional unit used to determine each impact measure, which is a square meter of insulation with an RSI value of ‘1.’
This typical impact table also illustrates a very important feature of many EPDs that may be problematic for the less mathematically inclined reader. As many of the unit impacts identified in the EPD are relatively small for the given functional unit, scientific notation frequently is use to express the measurement. As an example, ‘eutrophication potential’ in the summary table shown in Figure 6 is stated as 1.28E-03 in scientific notation. In decimals, this would be 0.00128, or 1.28 thousandths.