XPS delivers high R-values in below-grade applications
by sadia_badhon | August 27, 2020 10:24 am
by John Woestman
 [1]
[1]The thermal performance (R-value) of extruded and expanded polystyrene (XPS and EPS) insulation under roads and airfields in cold climates is critical to protect infrastructure from damage caused by permafrost thaw, frost heave, and seasonal thaw weakening. Therefore, the primary factors affecting in-service R-value performance, such as aging and moisture absorption, must be taken into consideration. Architects, engineers, consultants, and specifiers interested in the long-term performance of polystyrene insulation will appreciate a new report[2] based on test results from 15 field-extracted samples of polystyrene insulation from three different below-grade locations in Alaska.
There is an adage regarding constructing in cold regions: “If it is frozen, keep it frozen; if it is thawed, keep it thawed.”
The ground beneath many paved surfaces in Alaska is permafrost. It is vital to keep the ground frozen year round to maintain solid and stable foundations for paved surfaces. Since 1969, insulation has been used as one of several permafrost control features to help maintain the frozen ground’s structural integrity in the cold regions of North America. Polystyrene insulation buried under the paved surfaces helps block surface heat from melting the permafrost.
In the colder climates and higher elevations of the lower 48, light-use roadways and runways are susceptible to winter-time frost heave (irregular undulations of the road surface) and spring-time thaw softening. If the road’s foundation does not freeze, frost heave—caused by expansion of frozen subsoil moisture during the winter—is prevented. Further, come spring, if the road’s foundation is not frozen, subsoil moisture can migrate away all year round, preventing weakening of the road’s foundation. In these situations, insulation may be buried in the road’s foundation to prevent freezing below the insulation.
Regardless of the application, reliable thermal performance of insulation buried under roads and runways is critical for long-term performance of this infrastructure. XPS and EPS have been the predominant insulation options for these moist, below-grade applications.
Despite the widespread use of insulation beneath roadways and airfields, relatively few studies have been conducted on the long-term thermal performance of polystyrene insulations in such applications.
In 2019, a study[3] on the in-situ performance of XPS and EPS insulation was conducted by Billy Connor, PE, for the Alaska University Transportation Center, Fairbanks, Alaska. This study[4] includes new data, which adds to and complements the in-situ data points obtained by David C. Esch, a highway research manager with the Alaska Department of Transportation and Public Facilities, in 1986 and by Nadia Pouliot and Yves Savard (2003) (“High Density Expanded Polystyrene Boards as Road Insulation, Phase I, Performance Evaluation of Expanded Polystyrene on Road 161 in St-Martyrs-Canadiens” by Nadia Pouliot and Yves Savard [2003] was conducted for the Québec transport ministry). The 2019 study focuses on the measurement of R-values and moisture content in XPS and EPS samples obtained from multiple sites in Alaska.
The final report of the research titled, “Comparison of Polystyrene Expanded and Extruded Foam Insulation in Roadway and Airport Embankments,” also known as the Connor study (named after the study’s principal investigator), found the following:
- to deliver the same long-term, in-service thermal performance (R-value) in moist, below-grade applications, EPS needs to be one-and-a-half to two times thicker than XPS (it is important for the insulation to deliver the necessary thermal performance for many years even while exposed to moisture in below-grade applications);
- the new data points confirm previous results indicating higher R-value per inch of thickness for XPS compared to EPS;
- small-scale laboratory comparative tests used to classify EPS and XPS products (such as ASTM C272, Standard Test Method for Water Absorption of Core Materials for Sandwich Constructions, or ASTM D2842, Standard Test Method for Water Absorption of Rigid Cellular Plastics, referenced in ASTM C578, Standard Specification for Rigid, Cellular Polystyrene Thermal Insulation, and Underwriters Laboratories of Canada [CAN/ULC] S701.1, Standard for Thermal Insulation, Polystyrene Boards) do not fully account for moisture absorption and its impact on the actual, long-term R-value realized in the field;
- newer EPS products did not translate to improved R-value performance, evaluated after field extraction and years of exposure in below-grade applications; and
- moisture absorption with EPS has a greater negative impact on in-service R-value than moisture absorption and aging with XPS.
 [5]
[5]Background
The Connor study builds on the landmark Alaska study by Esch and the Pouliot and Savard research for the Ministère des Transports du Québec (MTQ). Prior to the Connor study, the longest-exposed, in-situ XPS sample was 25 years in service, and the longest-exposed EPS sample was only 15 years in service. Combining data points from Esch, Pouliot and Savard, and Connor, the total number of data points for XPS and EPS was 18 and seven, respectively. The Connor study provided additional data for EPS and XPS insulation, especially at a longer service life, allowing for an updated comparative assessment over a similar range of years in service.
Earlier studies
The Esch study (1986) looked at 14.7 lane-miles of roadways and 2972 m (9750 ft) of airfield runway constructed by the Alaska Department of Highways in order to control frost heaving and permafrost thawing. Insulation materials were installed below-grade in these applications in the late 1960s and extracted around 1984 for evaluation. The EPS samples were three and 15 years old and the XPS samples were three, five, 10, 15, 20, and 25 years old.
The Pouliot and Savard study (2003) later evaluated an experimental test roadway section approximately 385 m (1263 ft) long in Saints-Martyrs-Canadiens, Québec, Canada. Insulation was used to reduce the effects of seasonal freezing and thawing. In this application, the insulation was intended to prevent freezing of the road bed substrate. The study compared uninsulated roadway sections with insulated roadway sections using XPS and EPS insulation.
Frost heave of roadways and airport runways can cause significant cracking, undulations, ruts, and roughness. The MTQ study included an array of measurements of the road quality including surface distress, roughness, and bearing capacity. Measurements were made of rut depths. Roughness was measured by the International Roughness Index (IRI). Falling weight deflection (FWD) measurements were made as well.
Most importantly, data points were obtained for moisture content and thermal conductivity of the extracted XPS and EPS insulation. The latter measurements were relevant to the Connor study, which included similar data collected from beneath roadways and airfields in Alaska. The roadway of the MTQ study was constructed in 1995 and the XPS and EPS materials were extracted after one, three, five, and seven years in service.
EPS to XPS thickness ratio
When evaluating insulation options for demanding below-grade applications, a ‘thickness ratio’ of EPS relative to XPS, where each option may be expected to deliver comparable thermal performance over the long-term, can be a practical tool.
The recommended EPS insulation thickness is obtained by multiplying the required XPS thickness by an EPS/XPS thickness ratio. For example, if the engineering design requires 100 mm (4 in.) of XPS, and the recommended thickness ratio is 1:5, then the engineering specification should require 150 mm (6 in.) of EPS. In the 1986 Esch study, the recommended thickness ratio was 1.36. In the 2003 Pouliot and Savard report, the recommended thickness ratio was 1.20. In contrast, the Connor study suggests increasing the thickness of EPS by 1.5 to two times the thickness of XPS. An EPS/XPS thickness ratio typically is derived from existing design documents such as the American Society of Civil Engineers (ASCE) 32, Design and Construction of Frost-Protected Shallow Foundations. For insulation installed in the horizontal orientation of frost-protected shallow foundation applications, ASCE 32 and the International Residential Code (IRC) recommend a thickness ratio of 1.43 for Type IX EPS with R-2.8 compared to Type IV XPS with R-4. These insulation types have similar densities in ASTM C578. This calculated thickness ratio of 1.43 is based on an extensive literature review (consult “Below-Ground Performance of Rigid Polystyrene Insulation: Review of Effective Thermal Resistivity Values” by Jay H. Crandall, 2010).
The thickness ratio of 1.43, as prescribed by ASCE 32, accounts for the uncertainty in the efficacy of foundation drainage measures and the possible occurrence of more severe ground conditions. Along with the two earlier studies, the Connor report further informs these prescribed thickness ratios. The severity of ground conditions varies from site to site and is exacerbated with in-service years.
The Connor study
The Connor study provides new long-term, in-service data offering insight into the moisture performance of past and recent EPS and XPS products. The data shows the thermal and moisture performance of newer EPS products (after about five years in service) tracks well with older EPS products. The new data provides added confidence the current thickness ratios as prescribed in ASCE 32 as well as the Esch and the Pouliot and Savard studies are valid, or even underestimated the decrease in EPS thermal resistance over time. The data continues to validate the superior moisture and thermal performance of XPS products in below-grade applications.
 [6]
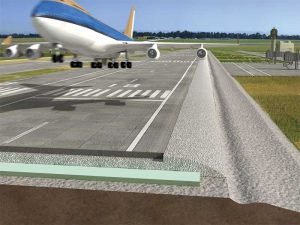
[6]Photo courtesy Kingspan
The EPS samples in the Connor study were subject to below-grade conditions for five years (Dalton Highway, Alaska) and 21 years (Cripple Creek Highway, Alaska). These sites were randomly selected because these insulated roadways were scheduled for maintenance and repair. Thus, the opportunity was presented to extract and evaluate in-situ foam insulation as part of the natural course of roadway and airfield repair and maintenance. The XPS insulation materials were subject to below-grade conditions for 31 years (Golivan Airport, Alaska).
The samples provide additional performance data for EPS and XPS after 21 and 31 years in service, respectively. The EPS and XPS samples extracted from the below-grade locations were studied extensively. The researchers found a distinct difference in effective R-value and water absorption performance.
The multiple sites allow performance to be examined across a wide range of conditions with a sample size sufficient to reveal long-term trends. During these long periods of time in service, the polystyrene insulation samples were exposed to the effects of aging, moisture absorption, drying, and compressive forces. Combining data from all three studies for EPS and XPS, respectively, sample sizes are 19 and 21; and the oldest ages in service are 21 and 31 years.
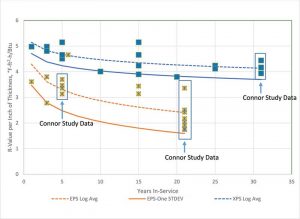
The Connor study test results indicate a rapid drop in R-value per inch for EPS in the first five years in service (with the in-service R-values per inch ranging from 3.13 to 3.70). By comparison, the R-values per inch for XPS only dropped gradually after five years in service on previously measured XPS samples (with R-values per inch ranging from 4.51 to 5.15). Further, the Connor study showed the R-values per inch for XPS decreased gradually, levelling out to an average value of about 4.1 after 31 years in service. By comparison, R-values per inch for EPS decreased rapidly, levelling out to an average value of about 2.2 after 21 years in service.
Figure 1 graphs the data points for in-service R-value per inch as reported in the Connor study. The new data points confirm previous results indicating higher R-value per inch for XPS compared to EPS. In fact, the new results indicate the previous results underestimated the decrease in EPS thermal resistance over time.
The Connor study develops the concept of average in-service R-value per inch minus one standard deviation (solid line in Figure 1) as a way to calculate insulation thicknesses needed to account for in-service exposure to severe below-grade environments.
Several other procedures and corresponding multipliers are proposed to account for decreases in R-values per inch with the length of time in service. Regardless of the procedure, the Connor study concludes EPS need to be 1.5 to two times thicker than XPS to equal the latter’s thermal performance.
Implications for further research
Factors influencing the performance of insulation in its application include R-values, moisture, temperature, aging, adjacent soil composition, water drainage, and material quality. All XPS and EPS polystyrene products are classified into types, according to small-scale laboratory comparative tests using ASTM C578, CAN/ULC S701.1 or the American Association of State Highway and Transportation Officials (AASHTO) M230, Standard Specification for Expanded and Extruded Foam Board (Polystyrene), specifications. It is misleading to extrapolate these small-scale results to imply an exact representation (or design value) of field performance, especially considering the many variables mentioned above.
For example, long-term thermal resistance (LTTR), or aging, which is based on a short-term, small-scale laboratory test, is inaccurately assumed by some to be the design R-value and the single most important product criteria (long-term thermal resistance [LTTR] represents the 15-year time weighted average R-value, equivalent to five-year storage at standard laboratory conditions and is defined as the design thermal resistance value). A single, small-scale test characteristic such as aging does not accurately predict the in-service design thermal resistance of insulation, especially when the actual field performance of the material has already been demonstrated in extreme real-life environments.
Further, a field study in one region of the country may not accurately predict the same performance in all regions of the country, considering the various different climates and soil conditions. Fortunately, these three studies examined multiple climates with severe freeze/thaw cycling such as Fairbanks, Alaska, and Québec. The studies provide critical long-term data, whereas the small-scale testing methods used to classify polystyrene are not indicative of performance over a period of time. The specifier is responsible to ensure this research data is applicable to their climatic region.
Another important finding of the Connor study points to the drawbacks of using small-scale moisture absorption testing as a predictor of in-service performance. Besides measurements of R-value per inch, moisture absorption was measured on all of the samples. The Connor study sought to correlate ‘water by volume’ data points with the R-value per inch data points. One EPS product claimed to have the same moisture absorption as XPS based on small-scale laboratory testing (as required by ASTM C578), yet the in-service performance was substantially different.
In other words, the improved EPS small-scale moisture absorption test results did not statistically improve the already rapid EPS R-value degradation due to in-service moisture absorption. In these studies, the relative difference in moisture absorption helps to explain the degradation in R-values below-grade when in-service. XPS absorbed less moisture than EPS on average in all of the studies. Hence, the need for a thickness ratio applied to EPS products for thermal equivalency.
Conclusion
In summary, through scientific study and empirical evidence, the resilience of XPS has been reaffirmed.
The study suggests small-scale tests used to classify products per ASTM C578 or CAN/ULC S701.1 do not account for the actual performance reductions in the field. Moisture absorption with EPS has a greater negative impact on in-service R-value than moisture absorption and aging with XPS. In harsh, below-grade applications, the research indicates that after moisture absorption very little drying of EPS and XPS occurs in-service.
As the most recent of three such studies, the Connor study confirms the higher thermal resistance of XPS compared to EPS. This can be attributed to the higher nominal R-value per inch of thickness of XPS and to the lower moisture absorption rate of XPS when compared to EPS. Further, the Connor study recommends an EPS-to-XPS thickness ratio of 1.5 to two (the author would like to appreciate the contributions made from members and associates of the Extruded Polystyrene Foam Insulation Association [XPSA] for the development of this article with special thanks to Rob Brooks, Rob Brooks & Associates, LLC, Eagle, Idaho; Barbara Fabian, Owens-Corning, Tallmadge, Ohio; Jeremy Smith, Kingspan, Atlanta, Georgia; and Guy Titley, Dupont, Sarnia, Ontario, Canada).
 [7]John Woestman is director of codes and standards to the Extruded Polystyrene Foam Association (XPSA). He has more than 30 years of experience in the building products industry with various responsibilities in construction, manufacturing, human resources, and marketing as well as codes, standards, and regulations. He graduated with a diploma in building trades, a degree in mechanical engineering, and an MBA. Woestman is a member of the International Code Council (ICC), the National Fire Prevention Association (NFPA), and ASTM International. He can be reached at jwoestman@kellencompany.com[8].
- [Image]: https://www.constructionspecifier.com/wp-content/uploads/2020/08/bigstock-View-Of-Dalton-Highway-With-Mo-227998135.jpg
- a new report: http://autc.uaf.edu/projects/2019/comparison-of-polystyrene-expanded-and-extruded-foam-insulation-in-roadway-and-airport-embankments
- a study: http://autc.uaf.edu/projects/2019/comparison-of-polystyrene-expanded-and-extruded-foam-insulation-in-roadway-and-airport-embankments
- This study: http://dot.alaska.gov/stwddes/research/assets/pdf/ak_rd_87_17.pdf
- [Image]: https://www.constructionspecifier.com/wp-content/uploads/2020/08/Figure-AUTC-plot-by-XPSA-for-Construction-Specifier.jpg
- [Image]: https://www.constructionspecifier.com/wp-content/uploads/2020/08/Kingspan-Type-V-100-psi-Runway.jpg
- [Image]: https://www.constructionspecifier.com/wp-content/uploads/2020/08/John-Woestman-Biopic.jpg
- jwoestman@kellencompany.com: mailto:jwoestman@kellencompany.com
Source URL: https://www.constructionspecifier.com/xps-delivers-high-r-values-in-below-grade-applications/